A recent snapshot of SoFi Technologies, Inc. (NASDAQ: SOFI) reveals a stock experiencing significant intraday volatility while trading near its 52-week high. This analysis breaks down the technical, fundamental, and sentiment indicators to provide a comprehensive overview for investors.
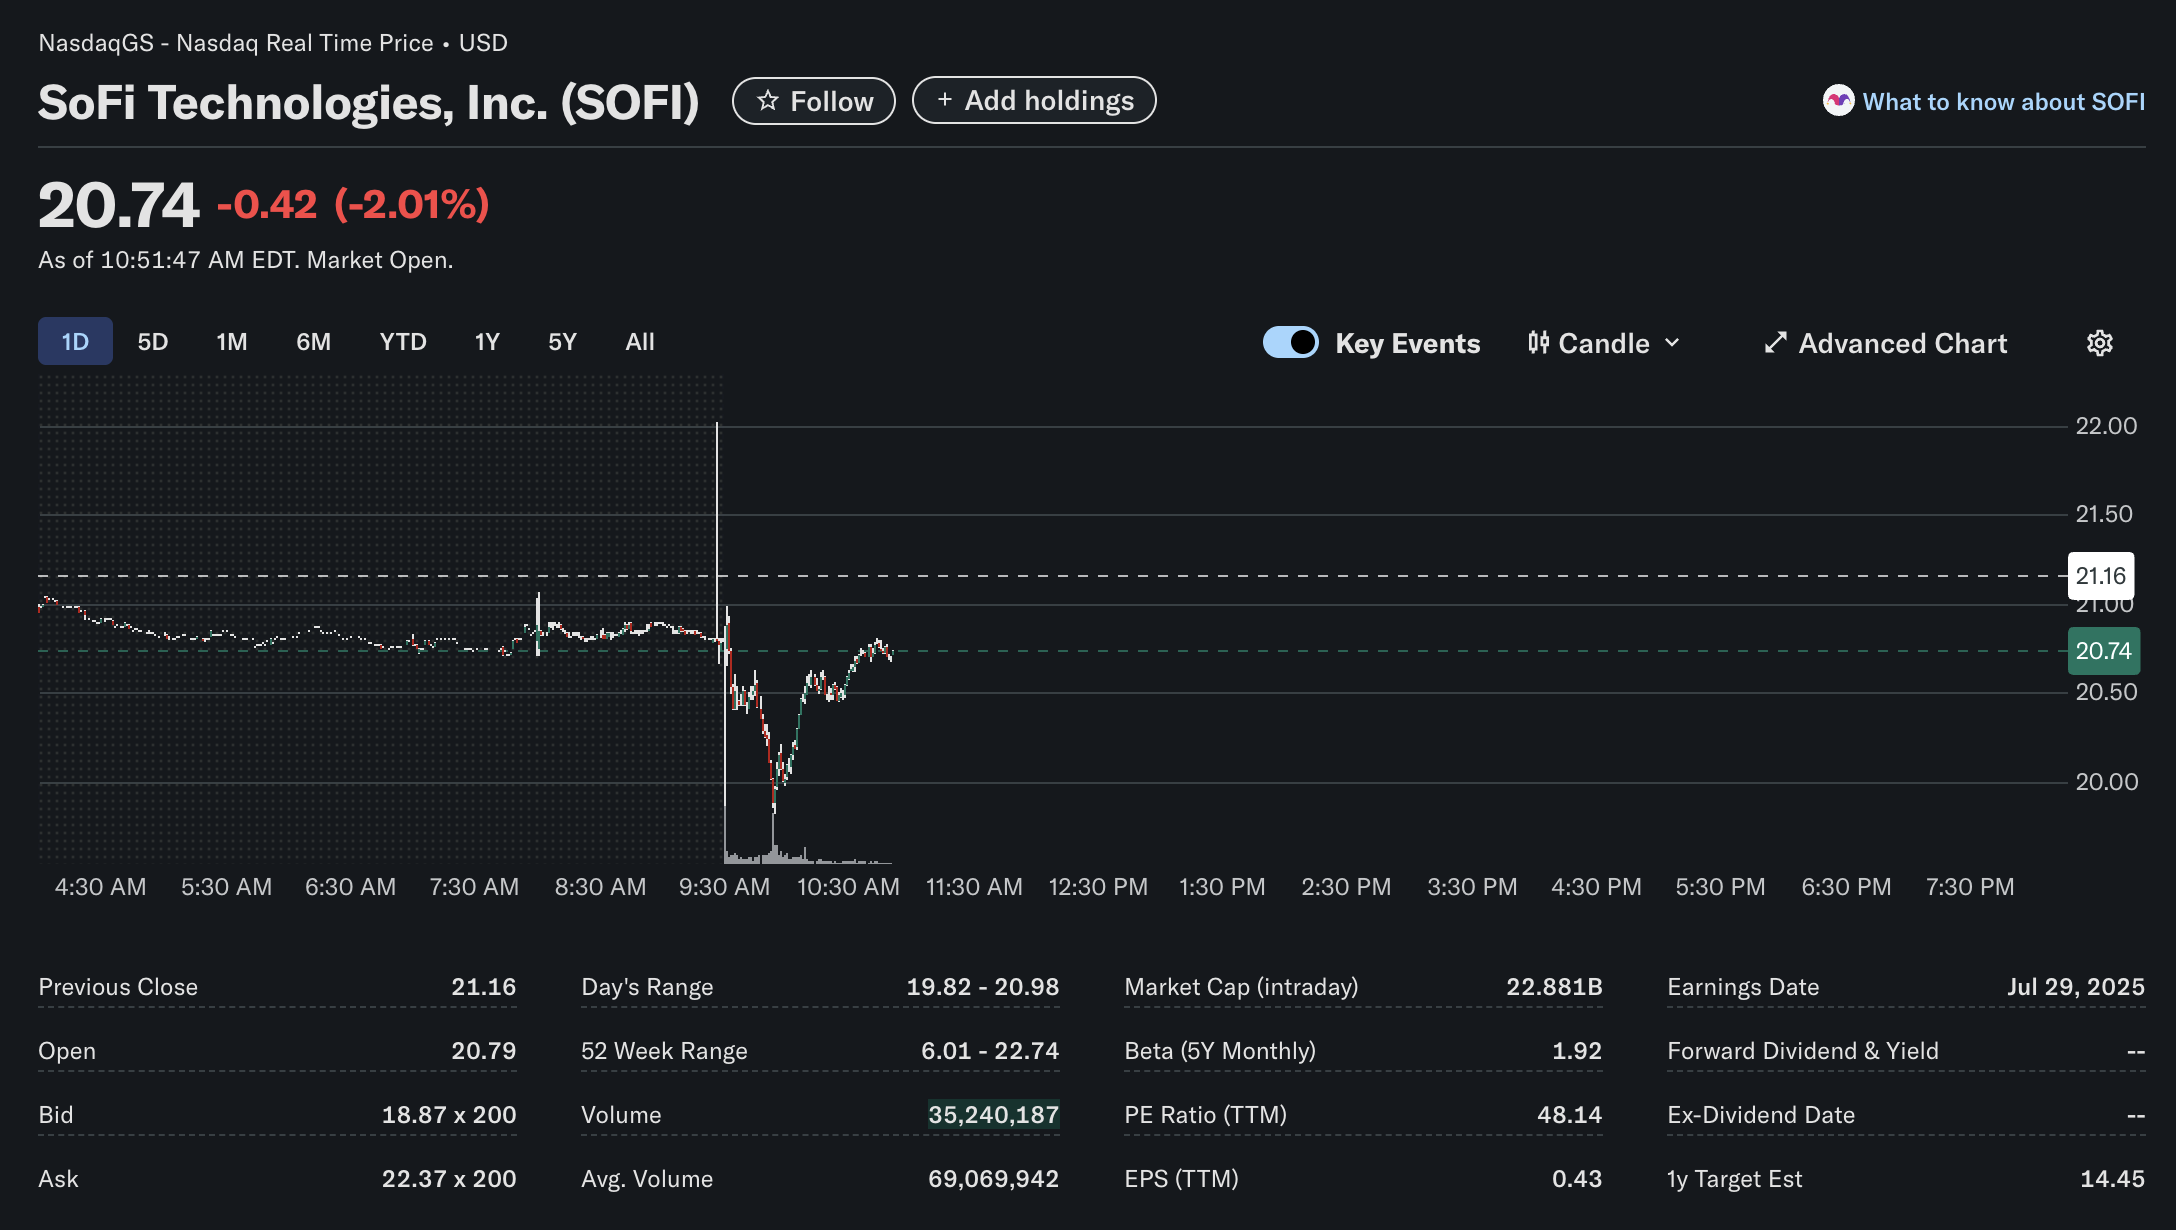
On the morning of this market snapshot, SoFi Technologies, Inc. was trading at 0.42 (-2.01%) for the session as of 10:51:47 AM EDT. The stock, a popular name in the fintech space, is showing signs of a dynamic trading day, reflecting a broader mix of market signals.
Technical Analysis: A Story of Intraday Volatility
A look at the 1-day chart provides a clear picture of the stock’s recent price action.
-
Price Action and Key Levels: SOFI opened the day at $20.79, slightly below its previous close of $21.16. The chart illustrates a sharp drop immediately following the market open at 9:30 AM, where the price hit the day’s low of $19.82. Since hitting that low, the stock has mounted a partial recovery. The current price of $20.74 remains below the important previous closing price, indicating short-term bearish pressure for the day.
-
Volume: The trading volume at the time of the image was 35,240,187 shares. While substantial, this is on track to be a relatively average day compared to its average volume of 69,069,942 shares. A notable spike in volume is visible on the chart, coinciding with the sharp price drop at the market’s open, suggesting a period of intense selling pressure.
-
Volatility: With a Beta of 1.92 (5Y Monthly), SOFI is significantly more volatile than the broader market. This characteristic is on full display in the day’s trading range of $19.82 to $20.98, showcasing its potential for large price swings.
Fundamental Analysis: A Growth Stock’s Profile
The fundamental data provides insight into SoFi’s valuation and financial standing.
-
Valuation: SoFi holds a substantial intraday market capitalization of 0.43. However, its Price-to-Earnings (P/E) ratio stands at a relatively high 48.14, which often indicates that investors have high expectations for future earnings growth.
-
Performance Context: The stock is trading near the upper end of its 52-week range of $6.01 – $22.74. This strong performance over the past year highlights significant investor confidence and upward momentum.
-
Dividends and Earnings: As is common with many growth-focused companies, SoFi does not currently pay a dividend, choosing to reinvest its earnings back into the business. The provided earnings date is listed as July 29, 2025, which investors should note may be a placeholder, as companies typically report earnings on a quarterly basis.
Sentiment Analysis: A Mixed Bag of Signals
Market sentiment towards SOFI appears complex and contains conflicting signals.
-
Bullish Sentiment: The stock’s proximity to its 52-week high suggests a strong positive sentiment from investors who have held the stock over the past year. The high P/E ratio also implies a degree of market optimism about the company’s future prospects.
-
Bearish Sentiment: The most striking piece of data is the 1-year analyst target estimate of $14.45. This consensus target is significantly below the current trading price of $20.74, suggesting that analysts, on average, believe the stock is currently overvalued and may face a correction. Furthermore, the stock’s negative performance on the day reflects short-term bearish sentiment among traders.
Summary
SoFi Technologies (SOFI) presents the profile of a classic high-growth, high-volatility stock. While it has demonstrated strong performance over the past year and is profitable, its high valuation metrics combined with a bearish analyst consensus target create a complex picture. Investors are currently weighing the company’s long-term growth potential against concerns of overvaluation and significant market volatility.
Disclaimer: This article is for informational purposes only and is based on a snapshot of market data at a specific point in time. It should not be considered financial or investment advice. All investors should conduct their own research and consult with a qualified financial professional before making any investment decisions.