Krispy Kreme Inc. (DNUT) experienced a significant and volatile intraday surge on July 23rd, with its stock price climbing over 18%. This report breaks down the technical, fundamental, and sentiment indicators based on the market data from that morning.
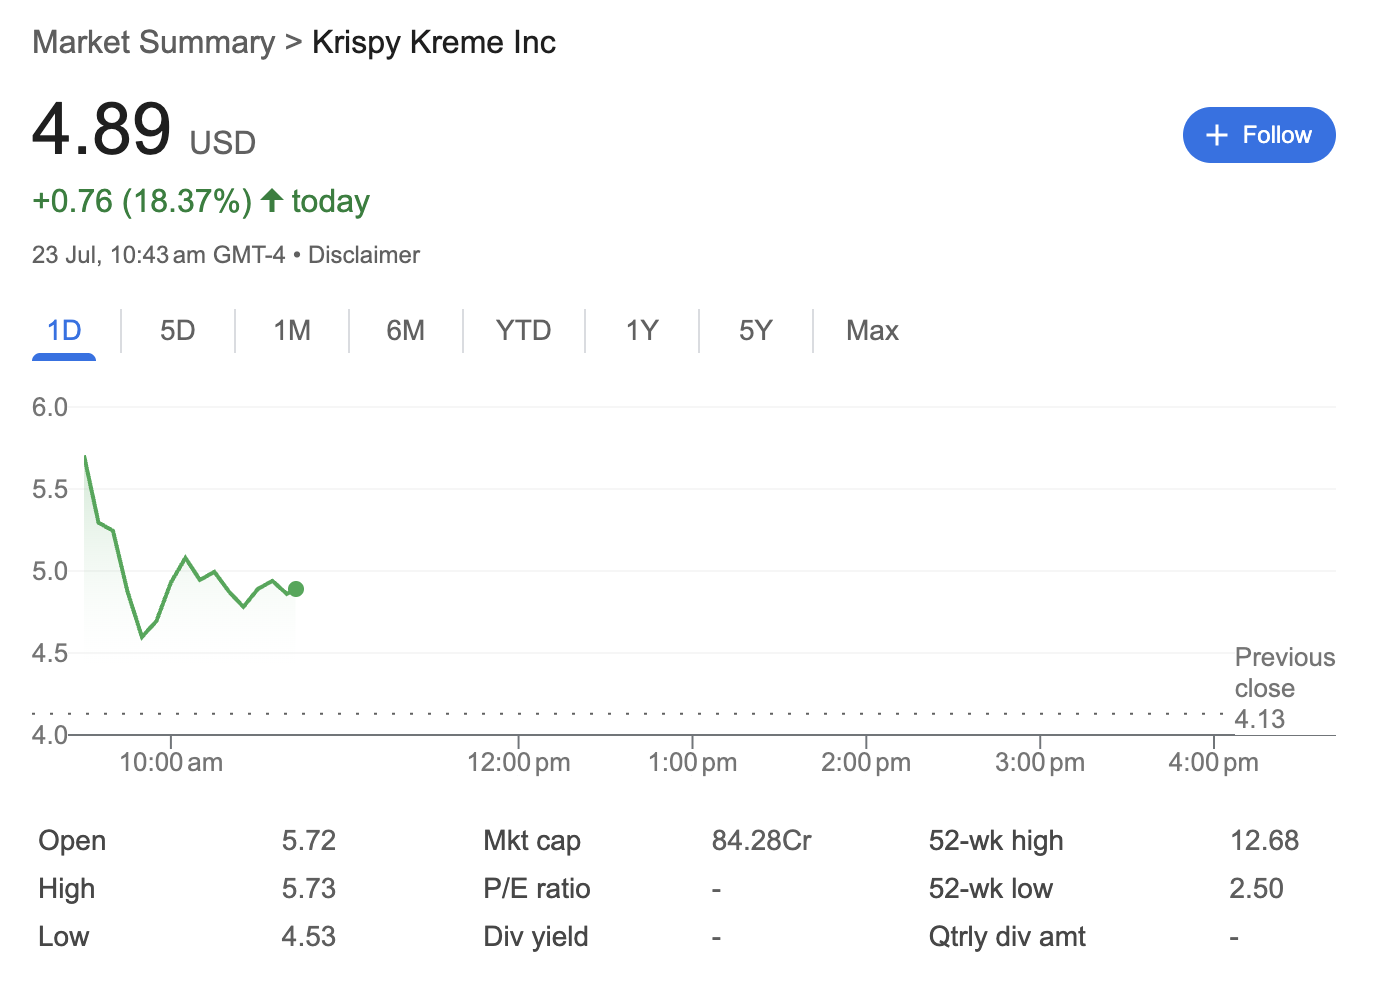
On the morning of July 23rd, at approximately 10:43 am GMT-4, shares of Krispy Kreme Inc. were trading at 4.89 USD. This marked a substantial gain of $0.76, or 18.37%, for the day, signaling strong positive momentum and attracting significant investor attention.
However, the session was marked by high volatility, as a closer look at the data reveals a dynamic battle between buyers and sellers.
Technical Analysis: A Story of a Gap-Up and Volatility
The intraday chart tells a compelling technical story.
-
Significant Gap-Up: The stock opened at 4.13. This type of “gap-up” typically indicates that significant positive news or a catalyst was released after the previous market close or during pre-market hours, leading to a flood of buy orders at the opening bell.
-
High Volatility: Despite the strong opening, the stock quickly faced selling pressure, dropping to an intraday low of 5.73) and low ($4.53) is over a dollar, which is substantial for a stock at this price point and highlights extreme volatility.
-
Price Context: Even with this impressive one-day gain, the stock at 12.68**. It is, however, trading well above its 52-week low of $2.50, suggesting a potential recovery from its lowest point in the past year.
Fundamental Analysis: A Limited But Telling Picture
The fundamental data available in the summary, while limited, provides important context.
-
Market Capitalization: The market cap is listed as 84.28Cr. The “Cr” notation, often standing for Crore in the Indian numbering system, suggests the data may be sourced from an international platform. Investors should verify this figure with primary US market data sources, as Krispy Kreme’s market capitalization on the Nasdaq is typically reported in billions of USD.
-
P/E Ratio: The Price-to-Earnings (P/E) ratio is listed as “-“. A non-existent P/E ratio usually signifies that the company has had negative earnings (a net loss) over the trailing twelve months. This suggests that, from a profitability standpoint, the company may be facing challenges.
-
Dividends: Both the Dividend Yield and Quarterly Dividend Amount are listed as “-“, indicating that Krispy Kreme Inc. does not currently pay a dividend to its shareholders. This is common for companies that are focused on growth or are not yet consistently profitable.
In summary, the fundamental data points to a company that may not be profitable, which contrasts with the strong positive stock performance of the day. This suggests the price surge is likely driven by factors other than the company’s recent earnings performance.
Sentiment Analysis: Clearly Bullish, But With Caution
Market sentiment for Krispy Kreme on this day was overwhelmingly positive, but with signs of caution.
-
Bullish Catalyst: The 18.37% surge is a clear indicator of strong bullish sentiment. A price movement of this magnitude is rarely random and is almost certainly tied to a specific event, such as positive corporate news, an analyst upgrade, or broader market speculation.
-
Profit-Taking: The sharp sell-off from the opening high indicates that many early investors or traders were quick to “take profits.” This created immediate resistance and shows that while many are buying, a significant number of shareholders were selling into the rally.
-
Renewed Buying Interest: The stock’s ability to bounce off its intraday low of $4.53 and climb back towards $4.89 suggests that buying pressure re-emerged, absorbing the initial sell-off and reaffirming the positive sentiment for the session.
Conclusion
The surge in Krispy Kreme’s stock price reflects a day of intense market interest and high volatility. While technical indicators and market sentiment point to a strong bullish wave, the limited fundamental data suggests underlying financial metrics may not be the primary driver. The day’s trading action—a large gap-up followed by a sharp dip and partial recovery—highlights a dynamic environment where news and speculation are likely playing a key role.
Disclaimer: This article is for informational purposes only and is based on data from the provided image. It should not be considered financial or investment advice. All investors should conduct their own thorough research and consult with a qualified financial professional before making any investment decisions.