The micro-cap stock saw a dramatic intraday spike, drawing significant attention. A closer look at the data reveals a picture of high-risk speculation and notable volatility.
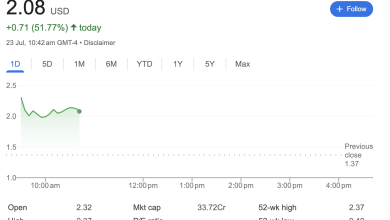
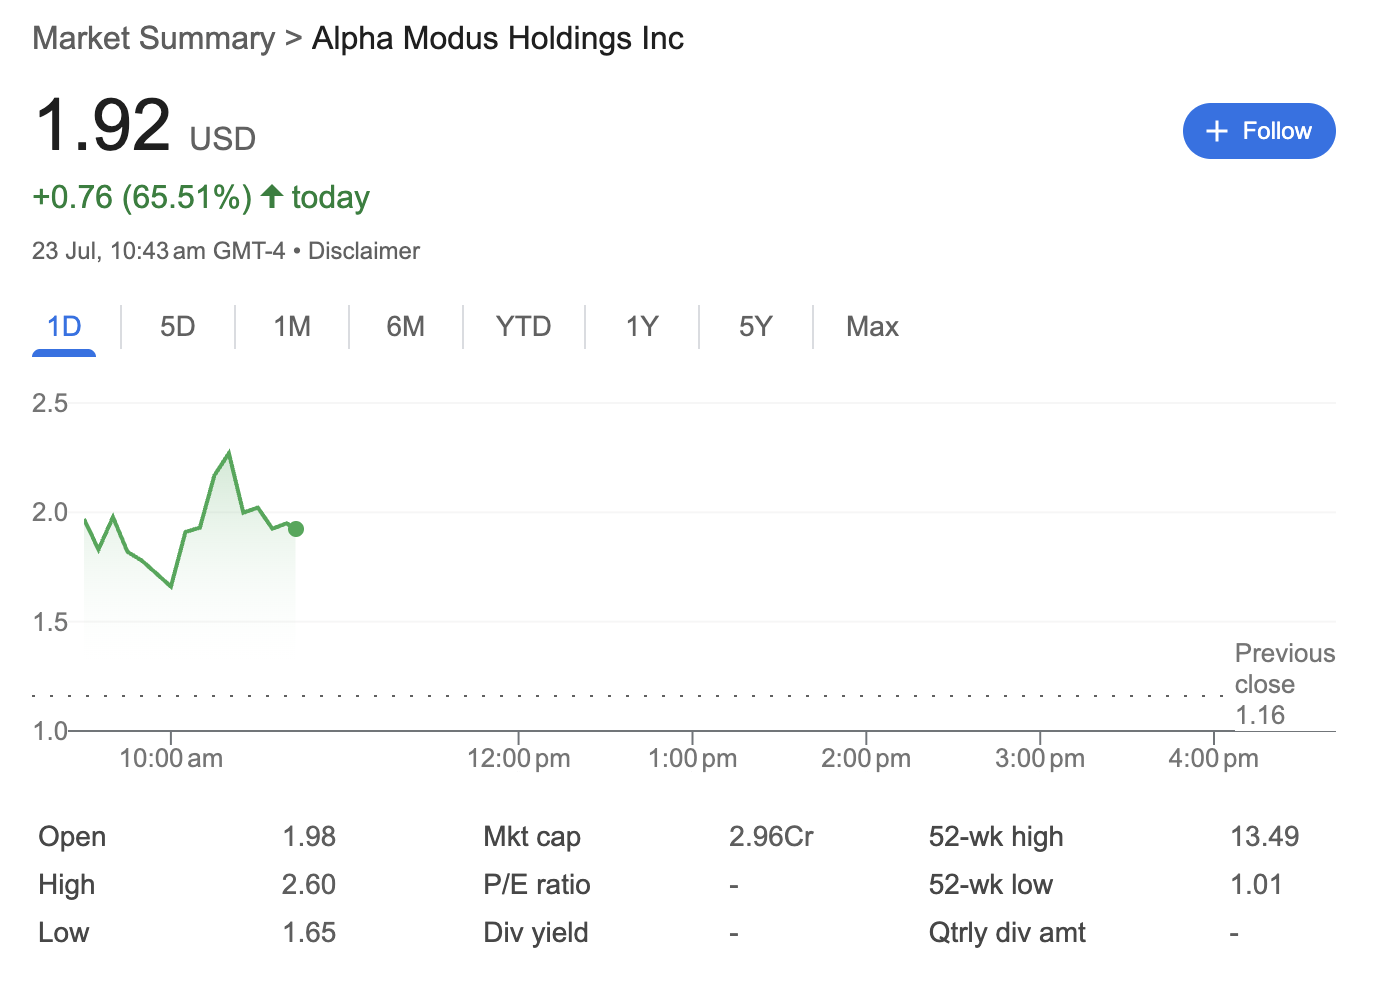
Alpha Modus Holdings Inc. experienced an extraordinary surge in its stock price during morning trading on July 23rd. As of 10:43 am GMT-4, the stock was trading at 1.92 USD, marking a substantial gain of +0.76 USD, or 65.51%, for the day. This sharp increase points to a sudden burst of investor interest in the company.
Here’s a breakdown of what the available data tells us from a technical, fundamental, and sentiment perspective.
Technical Analysis: A Story of Intraday Extremes
The technical data for the day paints a picture of extreme volatility. After closing the previous session at 1.16 USD, the stock gapped up significantly to open at 1.98 USD.
Key technical indicators for the day include:
-
Day’s High: 2.60 USD
-
Day’s Low: 1.65 USD
-
Previous Close: 1.16 USD
-
52-Week Range: 1.01 USD – 13.49 USD
The intraday chart shows the stock price spiking to a high of 2.60 USD shortly after the market opened before pulling back to its current level of 1.92 USD. This pattern suggests an initial buying frenzy followed by some profit-taking. While the current price represents a massive gain, it is considerably off its daily peak. Furthermore, the stock is trading much closer to its 52-week low (1.01 USD) than its 52-week high (13.49 USD), indicating that this single-day surge comes after a prolonged period of downward pressure or stagnant performance.
Fundamental Analysis: A Micro-Cap Profile
The fundamental metrics available provide insight into the company’s financial standing and classification.
-
Market Cap: 2.96Cr
-
P/E Ratio: Not Available (-)
-
Dividend Yield: Not Available (-)
With a market capitalization listed as 2.96Cr, Alpha Modus Holdings Inc. falls squarely into the micro-cap or nano-cap category. Stocks of this size are often associated with higher risk and greater price volatility.
The absence of a P/E ratio typically signifies that the company is not currently profitable or that earnings data is not available. Similarly, the lack of a dividend yield indicates that the company does not distribute profits to shareholders, which is common for smaller companies focused on growth and reinvesting capital back into their operations.
Sentiment Analysis: A Surge of Speculation
The day’s market activity is a strong indicator of current market sentiment. A 65.51% single-day gain reflects overwhelmingly positive, and likely speculative, short-term sentiment. Such dramatic price movements in micro-cap stocks are often triggered by specific news, a company announcement, or coordinated interest from retail traders.
However, the significant pullback from the day’s high of 2.60 USD suggests that sentiment is mixed. While one group of investors is buying aggressively, another is quick to sell and lock in profits, contributing to the high volatility. The contrast between this sudden bullish spike and the stock’s proximity to its 52-week low suggests that today’s activity is driven more by short-term speculation than by a fundamental shift in long-term investor confidence.
Disclaimer: This article is for informational purposes only and is based on publicly available market data at a specific point in time. It should not be considered financial or investment advice. Investing in securities, particularly micro-cap stocks, involves a high degree of risk. Readers should conduct their own thorough research and consult with a qualified financial professional before making any investment decisions.