
Eli Lilly And Co (LLY) closed with a modest gain on Wednesday, July 3rd, but the small green number hides a day of intense volatility that saw the stock plunge before buyers staged a powerful comeback. For traders looking ahead to Monday, the session provided critical clues about the stock’s underlying strength and key price levels to watch.
The pharmaceutical giant ended the day at
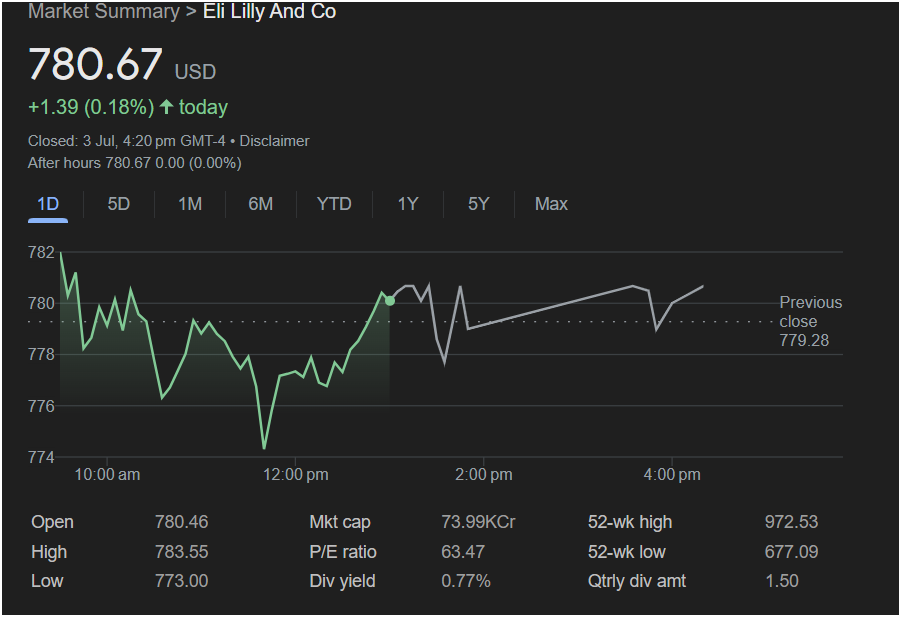
1.39 (0.18%). While the after-hours session remained flat, the intraday chart painted a dramatic picture of a battle between sellers and aggressive dip-buyers.
A Rollercoaster Session Deconstructed
The day’s trading was a tale of two distinct halves, offering crucial insights for investors:
-
Initial Strength and Rejection: The stock opened at $780.46 and climbed to a day’s high of $783.55 before being met with significant selling pressure.
-
A Sharp Plunge: In the late morning, sellers took firm control, driving the price down over
773.00**.
-
The V-Shaped Recovery: In a strong show of force, buyers entered the market aggressively around the $773 level, sparking a sharp V-shaped recovery that pushed the stock back into positive territory for the day.
-
Positive and Stable Close: The stock managed to close above its previous day’s close of $779.28, and after-hours trading showed no change, suggesting a neutral but firm sentiment heading into the weekend.
Key Financial Metrics for Your Radar
Before making a trade, every investor should be aware of these vital statistics:
-
Closing Price: $780.67
-
Day’s Range: $773.00 (Low) to $783.55 (High)
-
Previous Day’s Close: $779.28
-
P/E Ratio: 63.47 (Indicating high growth expectations from investors)
-
52-Week Range: $677.09 to $972.53
-
Dividend Yield: 0.77%
Outlook for Monday: Will the Stock Go Up or Down?
The dramatic intraday recovery is a strong bullish signal, but the initial weakness cannot be ignored. Here’s how to interpret the data for the upcoming session.
-
The Bullish Case: The most compelling evidence for a continued rise is the powerful rebound from the
783.55.
-
The Bearish Case: The sharp sell-off from the morning high shows that there are still sellers looking to take profits. If the stock fails to push past the $783 resistance level early on Monday, it could signal that the recovery has run out of steam, potentially leading to a retest of the lower support levels.
: Is It the Right Time to Invest?
While the momentum appears to be with the bulls following the strong recovery, a cautious approach is warranted. The most prudent strategy for traders on Monday would be to watch the key levels established on Wednesday.
-
A break above $783.55 would be a strong buy signal.
-
A drop below $773.00 would suggest the bears have regained control.
The price action between these two levels will likely be choppy. Waiting for the market to make a decisive move outside this range is the recommended course of action before committing to a new position.
Disclaimer: This article is an analysis based on the provided image and does not constitute financial advice. All investment decisions should be made with careful research and consultation with a financial professional.


