
Procter & Gamble Co. (P&G) finished a volatile trading session with a minor loss on Wednesday, July 3rd. While the after-hours session showed stability, the day’s price action reveals a battle between buyers and sellers that traders must watch closely heading into the next market open.
P&G stock closed the day at
0.37 (0.23%). The most notable feature of the session was an early-morning sell-off followed by an unusually flat afternoon, suggesting market indecision. For investors considering a position, here is a breakdown of the critical information.
A Closer Look at the Trading Day
The session’s performance highlights key support and resistance levels that will be crucial for Monday’s trading:
-
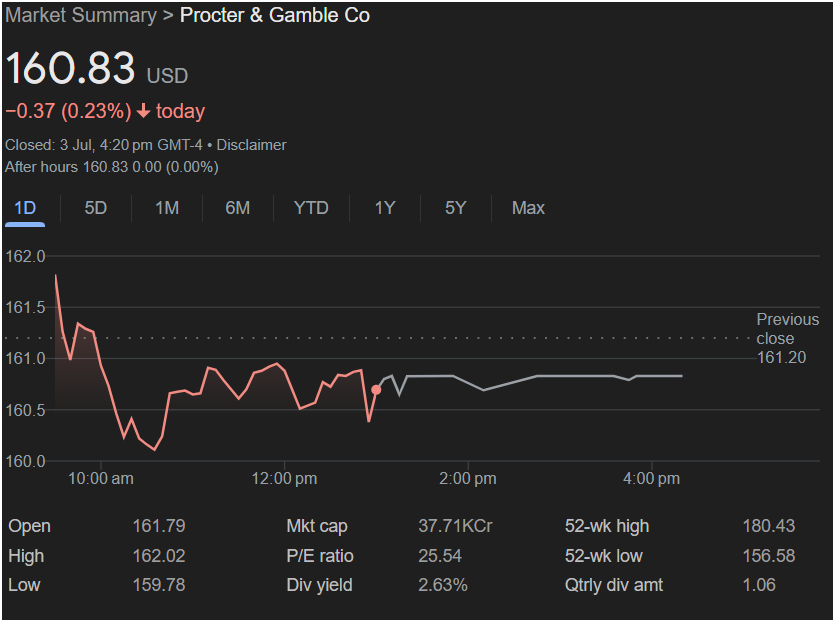
Weak Start: The stock opened at $161.79 and briefly touched the day’s high of $162.02 before facing immediate selling pressure.
-
Finding a Floor: Sellers pushed the price down to a daily low of $159.78, where it found significant support.
-
Afternoon Stalemate: After a partial recovery, the stock entered a period of extremely low volatility, trading in a tight, flat line for the last few hours of the session.
-
Neutral After-Hours: After-hours trading remained completely flat at $160.83, indicating that sentiment did not shift after the market’s close.
Essential Data for Traders
Before making any investment decision, consider these key metrics from the close of trading:
-
Closing Price: $160.83
-
Day’s Range: $159.78 (Low) to $162.02 (High)
-
Previous Day’s Close: $161.20
-
52-Week Range: $156.58 to $180.43
-
P/E Ratio: 25.54
-
Dividend Yield: 2.63%
-
Market Cap: 37.71KCr
Market Outlook for Monday: Up or Down?
The data presents conflicting signals, making P&G a stock to watch rather than jump into.
The primary challenge for the stock is that it closed below the previous day’s close of $161.20. The inability to reclaim this level during the day suggests underlying weakness.
Here’s the takeaway for investing ahead of Monday:
-
The Bearish Case: The morning sell-off shows that sellers are active. A break below the day’s low of $159.78 on Monday would be a significant bearish signal, potentially leading to a test of the 52-week low at $156.58.
-
The Bullish Case: The strong support found near the
161.20** resistance level.
Is It Right to Invest?
Given the standoff between buyers and sellers, it would be wise for traders to wait for a clear signal on Monday. The market’s direction will likely be determined by whether the stock breaks below its
161.20 resistance. The flat afternoon trading suggests the stock is coiling for its next move, making the first hour of Monday’s session critical to watch.
Disclaimer: This article is an analysis based on the provided image and does not constitute financial advice. All investment decisions should be made with careful research and consultation with a financial professional.

