
Costco Wholesale Corp. (NASDAQ: COST) stock wrapped up the pre-holiday session with a gain, but a day marked by significant volatility is giving traders plenty to analyze before the market reopens. While the retail giant closed in positive territory, the intraday price action reveals a tug-of-war between buyers and sellers that could define its next move.
Wednesday’s Trading Session Unpacked
Costco stock closed on July 3rd at
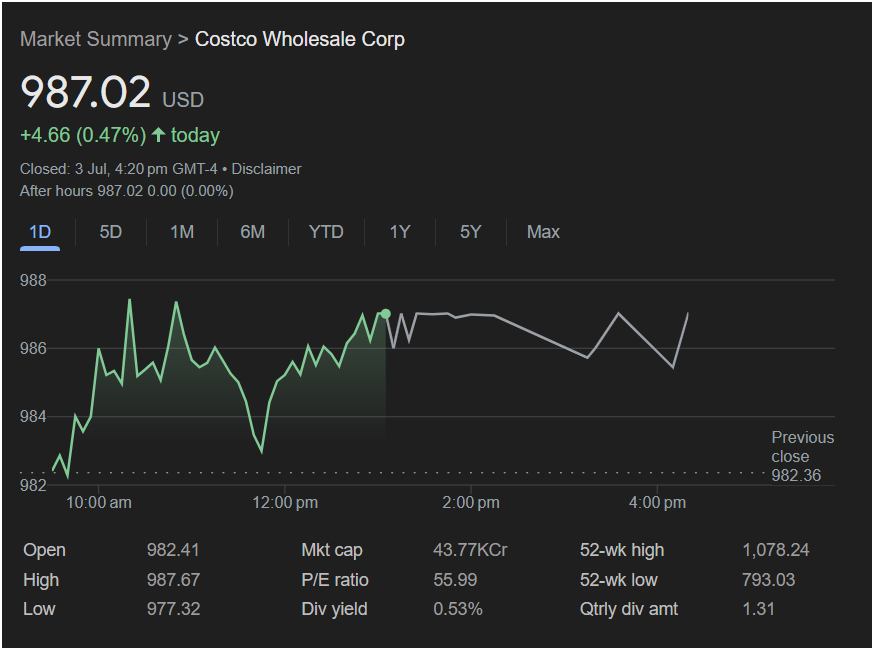
4.66 (0.47%). After-hours trading remained flat, indicating a neutral immediate reaction to the close. To understand where the stock might be headed, traders must look beyond the closing price and examine the day’s journey:
-
Intraday Volatility: The stock opened at $982.41 and quickly rallied to a daily high of $987.67. However, this peak was met with strong selling pressure, driving the price down to a low of $977.32 before noon. The impressive part for bulls is the subsequent recovery, where the stock steadily climbed back to re-test its highs before consolidating and closing strong.
-
Closing Above Support: The close at $987.02 is significantly higher than the previous day’s close of $982.36, confirming the bullish end to the session.
Key Financial Metrics for a Trader’s Radar
The broader financial context is crucial for assessing Costco’s position:
-
Market Cap: As a major large-cap company (with a market cap of approximately $437 Billion), Costco is a staple in many portfolios. The figure “43.77KCr” appears to be in Indian Lakh Crore, which translates to this major valuation.
-
P/E Ratio: A high Price-to-Earnings ratio of 55.99 indicates that investors have very high growth expectations baked into the current stock price. This makes the stock sensitive to any news that could affect its growth trajectory.
-
52-Week Range: The stock is trading in the upper echelon of its 52-week range ($793.03 – $1,078.24). This shows strong long-term momentum but also suggests it is closer to its peak than its trough.
-
Dividend Yield: A modest yield of 0.53% provides a small cushion but is not the primary reason most traders are in this stock.
Analysis: Will the Stock Go Up or Down on Monday?
The day’s chart presents conflicting signals, suggesting that the next move is not yet certain. A balanced approach is necessary.
The Bullish Case (Why it Might Go Up):
-
Resilience is Key: The powerful recovery from the intraday low of $977.32 shows that buyers are actively defending the stock and stepping in on dips.
-
Strong Close: Ending the day near the session’s high is a classic bullish sign, suggesting momentum may carry over.
The Bearish Case (Why it Might Go Down):
-
Stiff Resistance: The stock failed to break and hold above the $987.67 high. This level now acts as a clear point of resistance. The sharp sell-off from this point earlier in the day proves that sellers are active there.
-
High Valuation: With a P/E ratio near 56, the stock is priced for perfection. Any sign of slowing consumer spending or a broader market downturn could lead to a swift correction.
Is It Right to Invest Today? A Trader’s Action Plan
For a trader, Wednesday’s session set up clear battle lines for Monday. A “wait and see” approach at the opening bell is the most prudent strategy.
Your Actionable Takeaway:
Instead of guessing the direction, watch for the market to confirm its intentions.
-
Bullish Trigger: A sustained move above the daily high of $987.67 on Monday would be a strong buy signal. This would indicate that the bulls have overcome the day’s resistance and could be pushing towards the $1,000 psychological level and beyond.
-
Bearish Trigger: If the stock fails to break resistance and falls below the previous close of
977.32 would signal that the bears are in control and a deeper pullback could be coming.
In summary, Costco stock showed admirable strength in its recovery but also revealed a clear ceiling. The key to trading it next week will be to see which side wins the battle at these crucial price levels.
Disclaimer: This article is for informational purposes only and is based on the analysis of the provided image. It does not constitute financial advice. All investment decisions should be made with the help of a qualified financial professional and after conducting your own thorough research.


