
NVIDIA Corp (NASDAQ: NVDA) closed an impressive trading session on Friday, July 3rd, with a significant gain that pushed the stock to a new 52-week high. For traders preparing for the market open on Monday, the day’s price action provides critical clues about potential resistance and support levels.
This article provides a comprehensive breakdown of Friday’s trading data to help you understand NVIDIA stock’s current momentum and what to watch for in the upcoming session.
Today’s Market Performance: A Detailed Look
NVIDIA closed the regular trading day at
2.09 (+1.33%). The after-hours session showed a minor dip to $159.25, a negligible change that doesn’t significantly alter the bullish sentiment from the main session.
The intraday chart tells a story of strength followed by con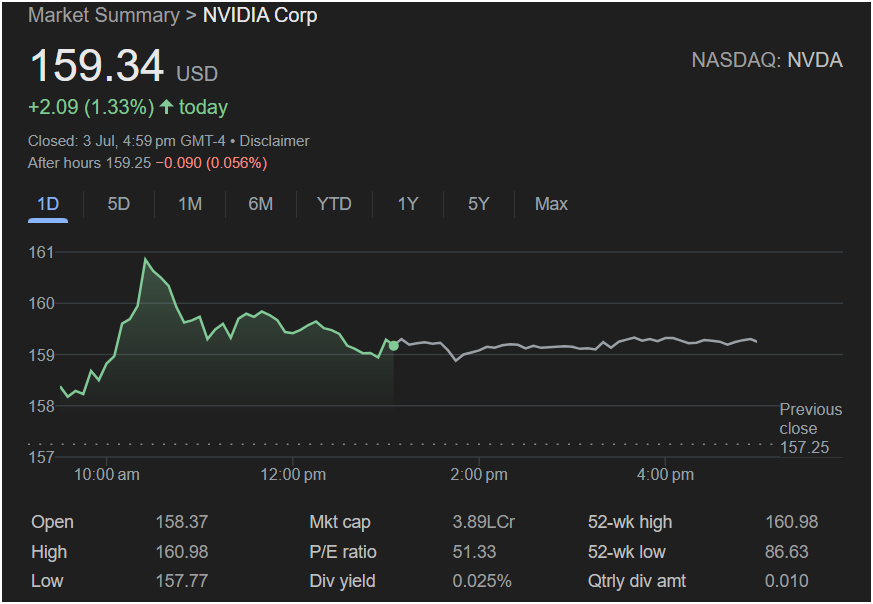 solidation:
-
Morning Surge: The stock opened at $158.37, already above the previous close of $157.25. It then experienced a powerful rally, surging to its session high in the first couple of hours.
-
Peak at New 52-Week High: The stock hit a High of $160.98, which is also its new 52-week high. This is a very strong bullish signal, indicating significant buying pressure and positive market sentiment.
-
Afternoon Consolidation: After reaching this peak, the stock pulled back and entered a consolidation phase, trading sideways for the remainder of the afternoon. It successfully held its ground above the $159 mark, demonstrating resilience.
The stock’s ability to close well above its Low of $157.77 and the previous day’s close suggests that buyers were in firm control for most of the day.
Key Financial Metrics for Traders
Understanding the fundamental numbers provides crucial context for the price action:
-
P/E Ratio: At 51.33, NVIDIA’s Price-to-Earnings ratio is high, reflecting strong investor confidence and high expectations for future earnings growth, largely driven by its dominance in the AI and semiconductor industries.
-
52-Week Range: The stock is trading at its absolute peak for the year, with a range from a low of
160.98. Trading at a 52-week high is a classic sign of a strong uptrend.
-
Market Cap: Listed at 3.89L Cr, NVIDIA stands as a tech behemoth and one of the largest companies globally by market capitalization.
-
Dividend Yield: The yield of 0.025% is minimal. Investors are attracted to NVIDIA for its capital growth potential, not for income generation.
Outlook for Monday: Will the Stock Go Up or Down?
Based on Friday’s closing data, here are the potential scenarios for the next trading day.
The Bullish Case (Potential for an Upward Move):
The most significant factor supporting a continued rally is the breakout to a new 52-week high. This event often attracts more buyers and momentum traders. For the upward trend to continue, traders will be watching for the stock to break and hold above the key resistance level of $160.98. A successful move past this point on Monday could signal that the next leg of the rally has begun, entering “blue-sky breakout” territory with no recent price history to act as resistance.
The Bearish Case (Potential for a Pullback):
The key point of caution is that the stock failed to close at its high. The level of
159.34 and, more significantly, the day’s low of $157.77.
Is It Right to Invest Today?
The technical picture for NVIDIA stock is overwhelmingly bullish due to the 52-week high breakout.
-
For a short-term momentum trader, the strategy is clear: watch the $160.98 level. A decisive break above it could present a buying opportunity. Conversely, a strong rejection at this level might signal a short-term top and a chance for a bearish play.
-
For a long-term investor, Friday’s action reinforces the powerful uptrend the stock has been in. While the high P/E ratio warrants consideration, the company’s fundamental strength in high-growth sectors is undeniable. A pullback could be seen as a buying opportunity for those looking to build a long-term position.
Ultimately, whether it’s the right time to invest depends on your individual risk tolerance and trading strategy. The evidence from Friday’s session, however, points toward continued strength.
Disclaimer: This article is for informational purposes only and is based on an analysis of the provided image. It does not constitute financial advice. Stock market trading involves significant risk, and past performance is not indicative of future results. Please consult with a qualified financial advisor before making any investment decisions.


