
Microsoft Corp (MSFT) stock demonstrated formidable strength on Friday, July 3rd, closing with a significant gain and briefly touching a major psychological milestone. This powerful performance has set the stage for a potentially pivotal trading session on Monday, with the stock knocking on the door of its 52-week high.
The tech giant’s stock finished the official trading day at
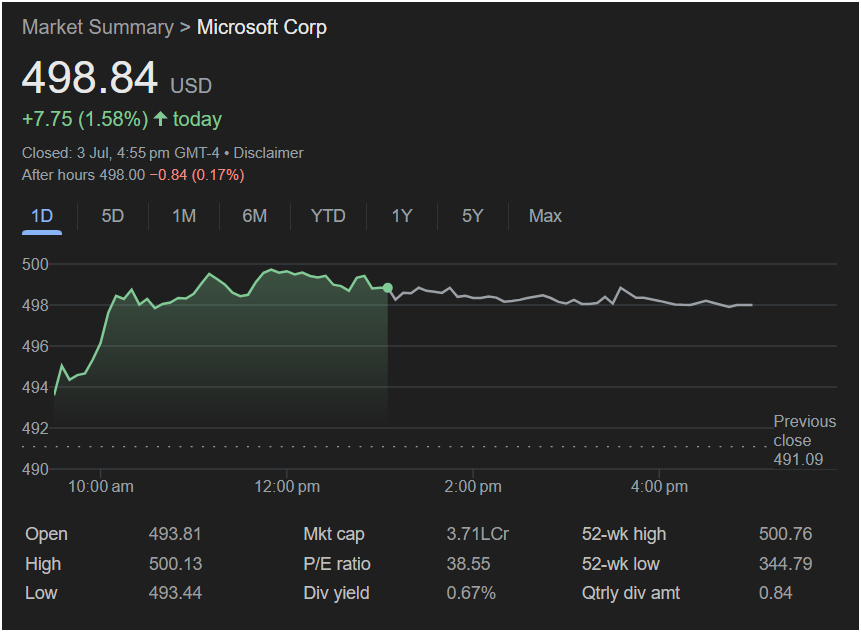
7.75 (1.58%). While a minor pullback occurred in after-hours trading, the day’s overwhelming momentum is the key story for traders to watch.
A Bullish Day of Dominance
Friday was a clear victory for the bulls. Microsoft’s stock opened at $493.81, well above the previous close of
500 barrier** to hit an intraday high of $500.13. After reaching this peak, the stock didn’t suffer a sharp sell-off; instead, it entered a consolidation phase, trading sideways for the remainder of the afternoon. This pattern of holding onto gains is a classic sign of underlying strength and investor confidence.
The after-hours session saw a slight dip of
498.00. This minor move is likely attributable to light profit-taking after a strong run-up and does not negate the day’s powerful bullish signal.
Key Metrics Every Trader Needs to Know
Before planning a move for Monday, traders should analyze these critical data points:
-
Proximity to 52-Week High: The intraday high of
500.76**. This level is now the most critical resistance point to watch. A decisive break above this could trigger a new wave of buying.
-
Psychological $500 Level: Breaching $500 is a significant psychological victory. The stock’s ability to hold near this level into the close is a very positive indicator.
-
Valuation (P/E Ratio): Microsoft’s P/E ratio stands at a healthy 38.55. For a mega-cap tech company with consistent growth, this is considered a reasonable valuation by many, suggesting the stock isn’t overly speculative.
-
Dividend Yield: With a dividend yield of 0.67%, Microsoft offers a small but stable income stream, which can attract long-term investors and provide a slight cushion during market pullbacks.
Will the Market Go Up or Down on Monday?
Based on Friday’s price action, the outlook for Microsoft stock on Monday is bullish.
The strong close and the breach of the $500 level indicate that buying pressure is high. The stock is in a clear uptrend, and the momentum is pointing towards another test of the 52-week high at $500.76. The minor after-hours dip may lead to a slightly lower open, but this could present a buying opportunity for traders who believe the upward trend will continue.
The primary scenario for Monday is a battle at the $500.76 resistance level. If the stock can break through and hold above this price, it would signal a bullish breakout, potentially leading to further gains as it enters new price territory. A failure to break this level could lead to a temporary pullback as traders take profits at the peak.
Is It Right to Invest Today?
The decision to invest hinges on your trading strategy and risk appetite, especially when a stock is at its peak.
-
For the Momentum Trader: The trend is your friend. The strong upward momentum makes this an attractive setup. A strategy could be to buy on a decisive breakout above the 52-week high, using the breakout level as a new support.
-
For the Cautious Investor: Buying a stock at its 52-week high carries inherent risk of a reversal. A more conservative approach would be to wait for a small pullback after the initial test of the high. Seeing if the stock can find support around the
500 level before entering a position could be a prudent move.
In summary, Microsoft stock closed the week on a high note, displaying significant strength and positive momentum. The stage is set for a crucial test of its 52-week high on Monday. Traders should watch the price action around the $500.76 level closely, as it will likely dictate the stock’s direction for the week ahead.
Disclaimer: This article is for informational purposes only and is based on the analysis of the provided image. It does not constitute financial advice. All investing involves risk, and you should conduct your own research or consult with a qualified financial advisor before making any investment decisions.


