
Meta Platforms Inc. (NASDAQ: META) closed the trading day on a positive note, but a deeper look into the session’s activity and after-hours trading suggests that investors should proceed with caution heading into the next market open. While the stock finished in the green, underlying weakness could influence its direction on Monday.
On Wednesday, July 3rd, Meta stock closed at
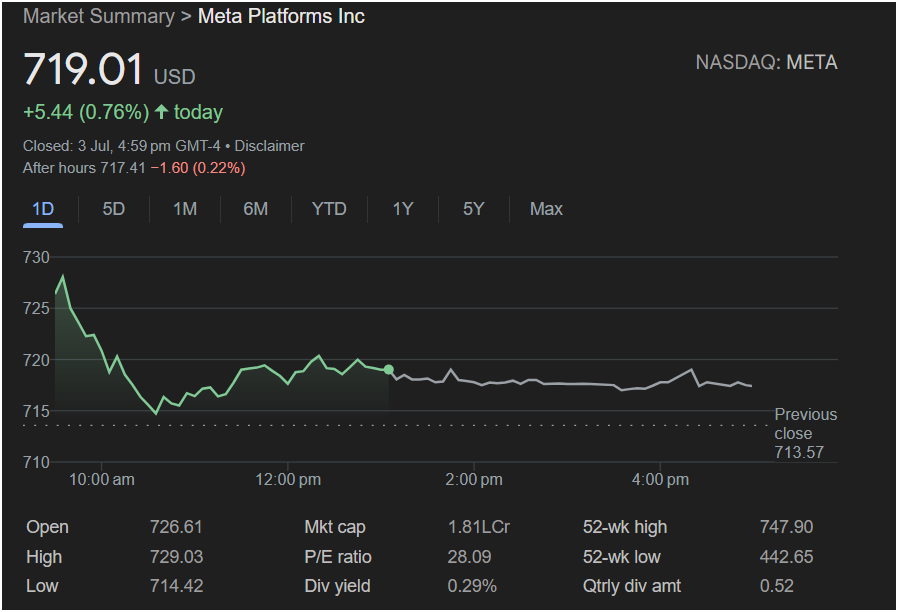
5.44 (0.76%) for the day. However, this figure only tells part of the story. For traders looking to decide whether to invest, a full breakdown of the day’s performance and key metrics is essential.
The Day’s Trading Unpacked
Despite the positive close, the intraday chart reveals a story of early selling pressure. Here’s a summary of the session:
-
Weak Opening: The stock opened high at $726.61 and quickly hit its peak for the day at $729.03.
-
Sharp Sell-off: Shortly after the open, sellers took control, pushing the price down to its daily low of $714.42.
-
Sideways Consolidation: For the majority of the trading day, META stock traded in a relatively tight range, hovering between $715 and $720, indicating a period of indecision between buyers and sellers.
-
After-Hours Dip: Crucially for predicting Monday’s open, after-hours trading saw the stock slip to
1.60 (0.22%). This suggests that sentiment turned slightly negative after the market closed, which could lead to a lower open in the next session.
Key Financial Metrics a Trader Needs
Here are the vital statistics from the close of trading that every investor should consider:
-
Closing Price: $719.01
-
Day’s Range: $714.42 (Low) to $729.03 (High)
-
52-Week Range: $442.65 to $747.90
-
Previous Day’s Close: $713.57
-
P/E Ratio: 28.09
-
Market Cap: 1.81L Cr
-
Dividend Yield: 0.29%
Outlook for Monday: Will the Stock Go Up or Down?
Based on the available data, the outlook for Meta stock is mixed, and traders should be prepared for potential volatility.
The positive closing price above the previous day’s close ($713.57) is a bullish signal. However, the negative after-hours performance and the fact that the stock spent most of the day well below its opening price are significant bearish indicators.
Here’s the takeaway for investing today:
-
Bearish Case: The after-hours drop and the sharp morning sell-off suggest that the path of least resistance might be downwards at the start of the next trading day. A key support level to watch is the day’s low of $714.42. If the stock breaks below this level, it could signal further selling pressure.
-
Bullish Case: If broader market sentiment is strong on Monday, buyers could shrug off the after-hours dip. For the stock to regain its upward momentum, it would need to reclaim and push past the day’s high of $729.03.
It would be prudent for traders to wait for the market to open on Monday to see which direction gains control. The intraday weakness suggests that jumping in immediately may be risky. Observing the first hour of trading will provide a clearer picture of whether the after-hours selling will continue or if buyers will step in to defend the recent gains.
Disclaimer: This article is an analysis based on the provided image and does not constitute financial advice. All investment decisions should be made with careful research and consultation with a financial professional.


