
Broadcom Inc. (NASDAQ: AVGO) delivered a strong performance in its last trading session, closing with significant gains and leaving traders to speculate on its trajectory for the coming week. With the stock showing bullish momentum, a close look at the data provides crucial insights into whether now is the right time to invest.
This article breaks down the key metrics and chart patterns from Friday, July 3rd, to help you prepare for Monday’s market open.
 Friday’s Market Action: A Summary of Strength
A comprehensive review of the provided market data paints a bullish picture for Broadcom. Here’s what every trader needs to know:
-
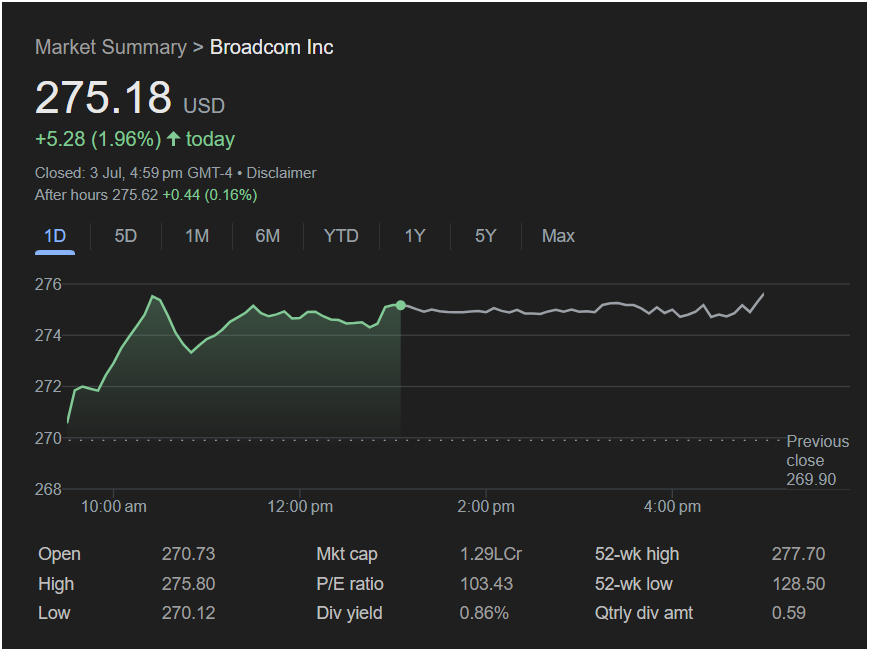
Strong Close: The stock closed at
5.28 (1.96%) for the day. This solid green close indicates strong buying pressure throughout the session.
-
After-Hours Momentum: The positive sentiment continued after the bell, with the stock ticking up another $0.44 (0.16%) in after-hours trading to reach $275.62. This often suggests that momentum may carry over into the next trading day.
-
Trading Near Peak Levels: The day’s high was $275.80, just shy of the 52-week high of $277.70. Trading near a yearly peak is a sign of powerful underlying strength and investor confidence in the stock.
-
Intraday Performance: The stock opened at $270.73, well above the previous close of $269.90, and never looked back. After a strong rally in the morning, it consolidated in the afternoon, holding its gains firmly.
Will the Broadcom Stock Go Up on Monday? The Bull vs. Bear Case
Based on the technical signals, the outlook for Monday appears positive, but traders should be aware of potential risks.
The Bullish Case (Why the Stock Could Rise):
The primary argument for a continued rally is momentum. The strong close, positive after-hours activity, and proximity to the 52-week high are all classic bullish indicators. Traders who follow trends will see this as a signal that the stock has the strength to break through the $277.70 resistance level. A successful break above this price, especially on high trading volume, could trigger a further upward move.
The Cautious Case (Why It Might Pull Back):
Despite the positive signs, there are two key reasons for caution:
-
High Valuation: The P/E ratio stands at a lofty 103.43. A high Price-to-Earnings ratio suggests that the stock is priced for perfection, with high growth expectations already factored in. Such stocks can be vulnerable to sharp pullbacks if the broader market turns negative or if company news doesn’t meet expectations.
-
Resistance at the 52-Week High: While being near a high is a sign of strength, the level itself often acts as a psychological and technical barrier. Some investors who bought at lower prices may choose to sell and take profits at this level, creating selling pressure that could cause the stock to stall or reverse.
Verdict for Traders: Should You Invest?
The decision to invest in Broadcom stock on Monday depends heavily on your trading style and risk tolerance.
-
For Momentum Traders: The current trend is undeniably upward. A strategy could be to watch for a decisive break above the $277.70 52-week high. A move past this level could signal the start of the next leg up.
-
For Cautious or Value-Oriented Investors: The high P/E ratio is a significant red flag. It may be more prudent to wait for a potential pullback. A dip back towards the
270−270-272 range could offer a more attractive entry point with a better risk-reward profile.
In conclusion, Broadcom stock is entering the new week with powerful bullish momentum. While the path of least resistance appears to be upward, the high valuation and the key resistance level at the 52-week high demand a careful and strategic approach. Keep a close eye on the opening price and trading volume on Monday to confirm the trend’s direction.
Disclaimer: This article is for informational purposes only and does not constitute financial advice. All investment decisions should be made based on your own research and financial situation.

