
Citigroup Inc (C) stock finished the last trading session with a nearly flat close, but don’t let the headline number fool you. A pronounced intraday downtrend and a significant pre-market drop are sending clear warning signals to traders ahead of the new week, suggesting that the path of least resistance may be downwards on Monday.
For any trader evaluating Citigroup, here is a complete breakdown of the critical data and what it means for your next move.
 Today’s Session: A Story of Fading Strength
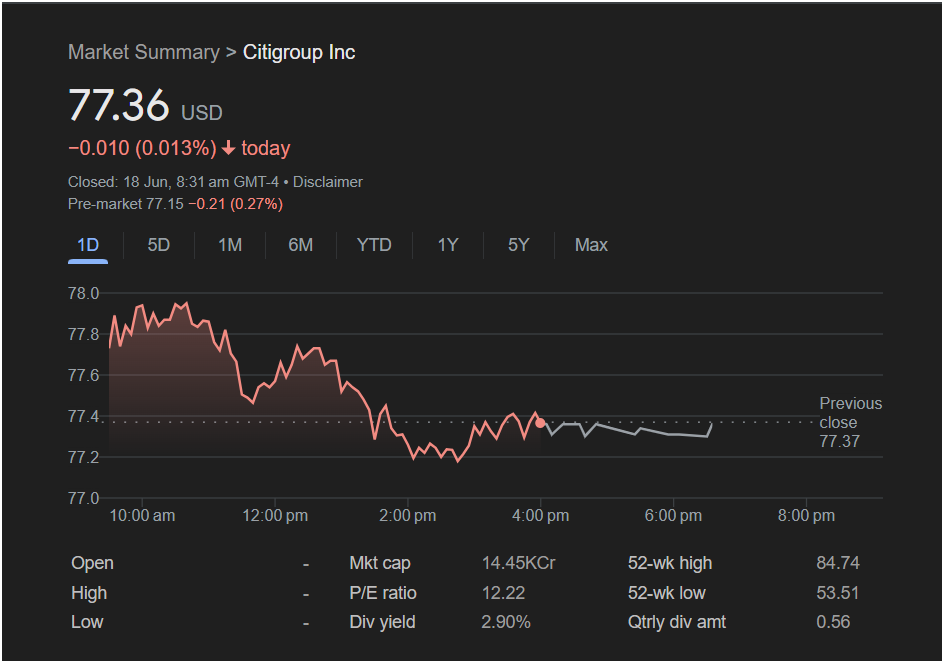
Citigroup Inc. closed at 77.36 USD, down an almost negligible 0.010 (0.013%). However, the daily chart reveals a more bearish narrative. The stock opened the day on a strong note, peaking near the $78.0 mark, but sellers took control almost immediately. The price then trended steadily lower for the majority of the session, bottoming out around the $77.2 level before a minor recovery into the close.
The stock finished just a hair below its previous close of 77.37. This combination of a strong start followed by a sustained sell-off indicates that bearish sentiment dominated the day, a momentum that often spills over into the following session.
Pre-Market Data Signals a Lower Open
The most significant red flag for Monday comes from the pre-market activity. The data shows Citigroup trading at 77.15, a decline of 0.21 points (0.27%). This is a much more substantial move than the previous day’s close and strongly suggests the stock will likely open lower on Monday.
Traders should watch the
77.37 mark to neutralize the immediate bearish pressure.
The Long-Term View: A Compelling Value Case?
While the short-term technicals are flashing caution, the fundamental metrics for Citigroup stock present a different, more attractive picture for long-term investors:
-
P/E Ratio: Citigroup’s price-to-earnings ratio is a very low 12.22. This suggests that the stock is potentially undervalued compared to its earnings, a key metric for value investors.
-
Dividend Yield: With an attractive dividend yield of 2.90% and a quarterly dividend of 0.56, the stock offers a solid income stream, making it appealing for those seeking returns beyond just price appreciation.
-
52-Week Range: The stock is trading well above its 52-week low of 53.51 but remains noticeably below its high of 84.74. This indicates that while the stock has recovered significantly, there may still be room to run if it can overcome short-term hurdles.
-
Market Capitalization: At 14.45KCr, Citigroup is a financial giant, offering the stability associated with a blue-chip stock.
The Verdict: How Should You Trade Citigroup Stock Today?
Based on this analysis, here is the outlook:
-
For the Short-Term Trader: The signals are predominantly bearish. The intraday downtrend and the negative pre-market data point to a high probability of a lower open or continued weakness on Monday. It would be wise to exercise caution and avoid jumping into a long position at the open. Wait for signs of price stabilization or a confirmed reversal.
-
For the Long-Term/Value Investor: The narrative is much more positive. The stock’s low P/E ratio and strong dividend yield make it fundamentally appealing. A potential dip on Monday, as suggested by the pre-market data, could be an excellent opportunity to initiate or add to a long-term position at a more favorable price.
In conclusion, Citigroup stock presents a classic clash between bearish short-term technicals and bullish long-term fundamentals. Day traders should be on guard for a downward move, while long-term investors might see any weakness as a chance to buy.
Disclaimer: This article is for informational purposes only and is based on the provided image. It does not constitute financial advice. All investors should conduct their own research and consult with a financial professional before making any investment decisions.

