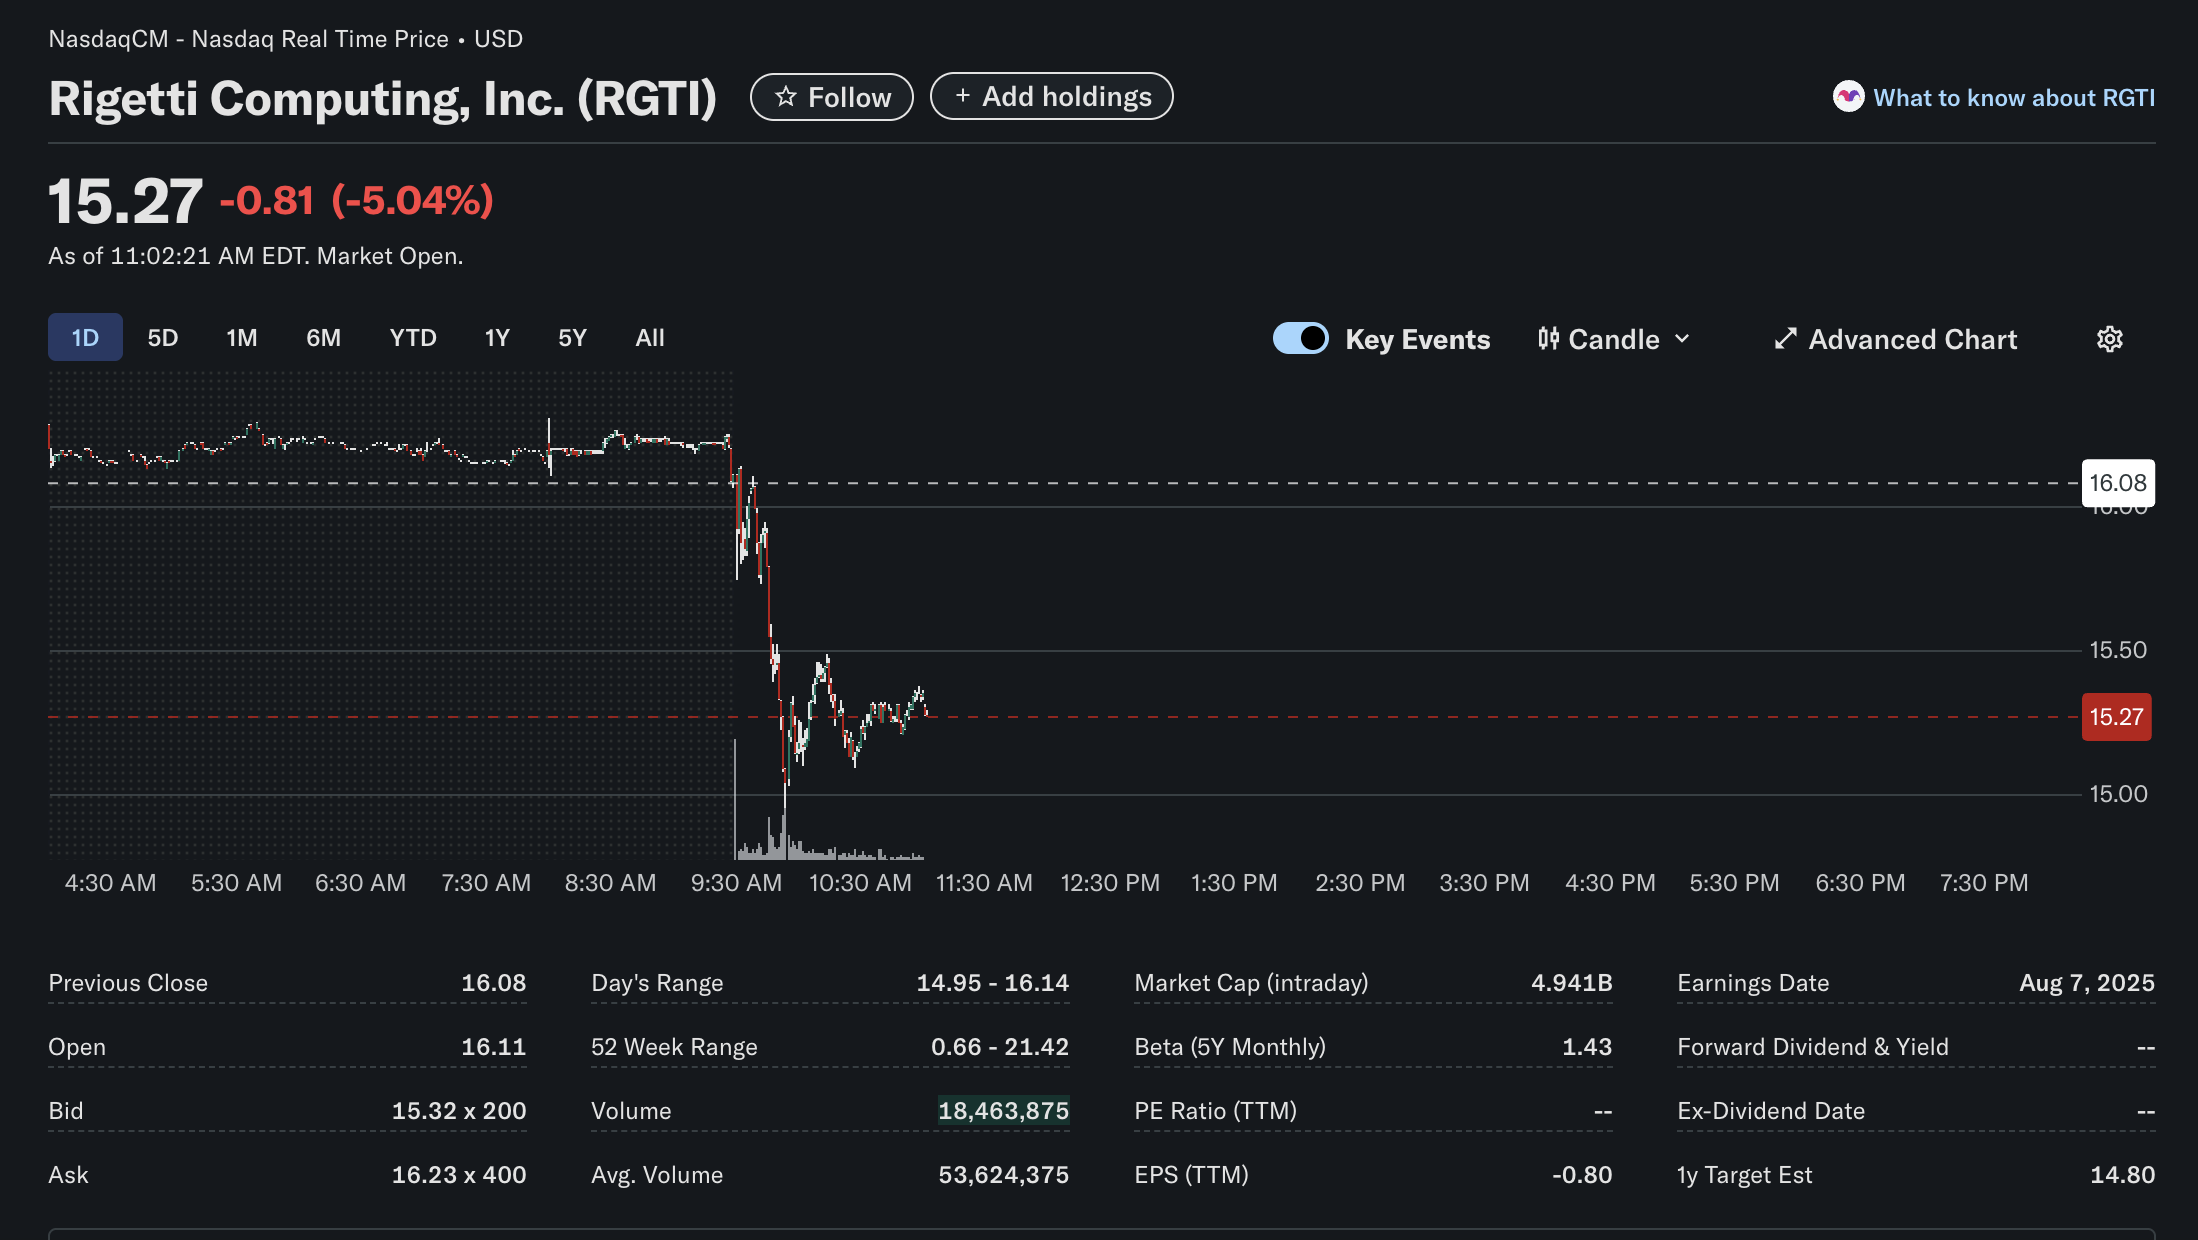
Shares of Rigetti Computing, Inc. (RGTI), a key player in the quantum computing sector, experienced a significant drop in Tuesday’s trading, highlighting the stock’s inherent volatility. As of 11:02 AM EDT, the stock was trading at 0.81 or 5.04% for the session.
The sharp decline prompts a closer examination of the company’s performance through the lenses of technical, fundamental, and sentiment analysis.
Technical Analysis
The intraday chart for RGTI shows a dramatic sell-off at the market open. After closing the previous day at $16.08, the stock opened slightly higher at $16.11 but was immediately met with intense selling pressure at 9:30 AM.
This move was accompanied by a large volume spike, signaling a decisive and powerful shift in momentum. The stock plunged to a day’s low of $14.95 before finding some footing and consolidating around the $15.27 level.
Key Technical Points:
-
Price Action: The stock is in a clear intraday downtrend. The previous close of $16.08 has now flipped from support to a key resistance level.
-
Volume: The trading volume of over 18.4 million shares by mid-morning indicates heavy trading activity, although it is tracking below the average volume of 53.6 million, suggesting the initial sell-off was the main event.
-
52-Week Range: The stock’s 52-week range of $0.66 – $21.42 illustrates its extreme volatility and its significant run-up from the lows over the past year. The current price is closer to the upper end of this range but is now retreating from its recent highs.
Fundamental Analysis
The fundamental data for Rigetti paints the picture of a speculative, pre-profitability growth company.
-
Profitability: Rigetti is not currently profitable, as shown by its negative Earnings Per Share (EPS TTM) of -$0.80. Consequently, it has no Price-to-Earnings (P/E) ratio, a common characteristic of companies in the developmental stage.
-
Valuation: Despite the lack of earnings, the company commands an intraday Market Cap of $4.941B. This valuation is based on investor belief in the long-term potential of its quantum computing technology rather than current financial performance.
-
Volatility: The stock’s Beta (5Y Monthly) is 1.43, confirming that it is significantly more volatile than the broader market. This means it tends to experience larger price swings in both directions.
-
Analyst Outlook: The 1-year Target Estimate is $14.80. This is a critical metric, as the average analyst price target is currently below the stock’s trading price. This suggests that, on average, Wall Street analysts believe the stock may be overvalued at its current levels.
-
Dividends: RGTI does not pay a dividend, as it is focused on reinvesting capital to fund research, development, and growth.
Sentiment Analysis
The market sentiment for RGTI appears to be a battle between long-term speculative hope and short-term valuation concerns.
-
Bearish Short-Term Sentiment: The sharp 5% decline on heavy opening volume is a clear signal of negative sentiment in the current session. This could be driven by profit-taking after its recent run-up, or a broader risk-off sentiment in the market for speculative technology stocks.
-
Cautious Analyst Sentiment: The analyst consensus price target sitting below the current market price indicates a cautious, if not skeptical, view from the professional community regarding the stock’s near-term valuation.
-
Speculative Bullish Sentiment: The multi-billion dollar market capitalization for an unprofitable company reflects strong underlying belief from a segment of investors. These bulls are betting on Rigetti’s ability to eventually commercialize its technology and become a leader in the nascent quantum computing industry.
In conclusion, Rigetti Computing (RGTI) is a high-risk, high-reward investment. The day’s price action shows that while there is significant long-term hope priced into the stock, it remains highly sensitive to shifts in market sentiment and scrutiny over its fundamental valuation.
Disclaimer: This article is for informational purposes only and is based on data from the provided image at a specific point in time. It does not constitute financial, investment, or trading advice. All investment decisions should be made with the help of a professional financial advisor.