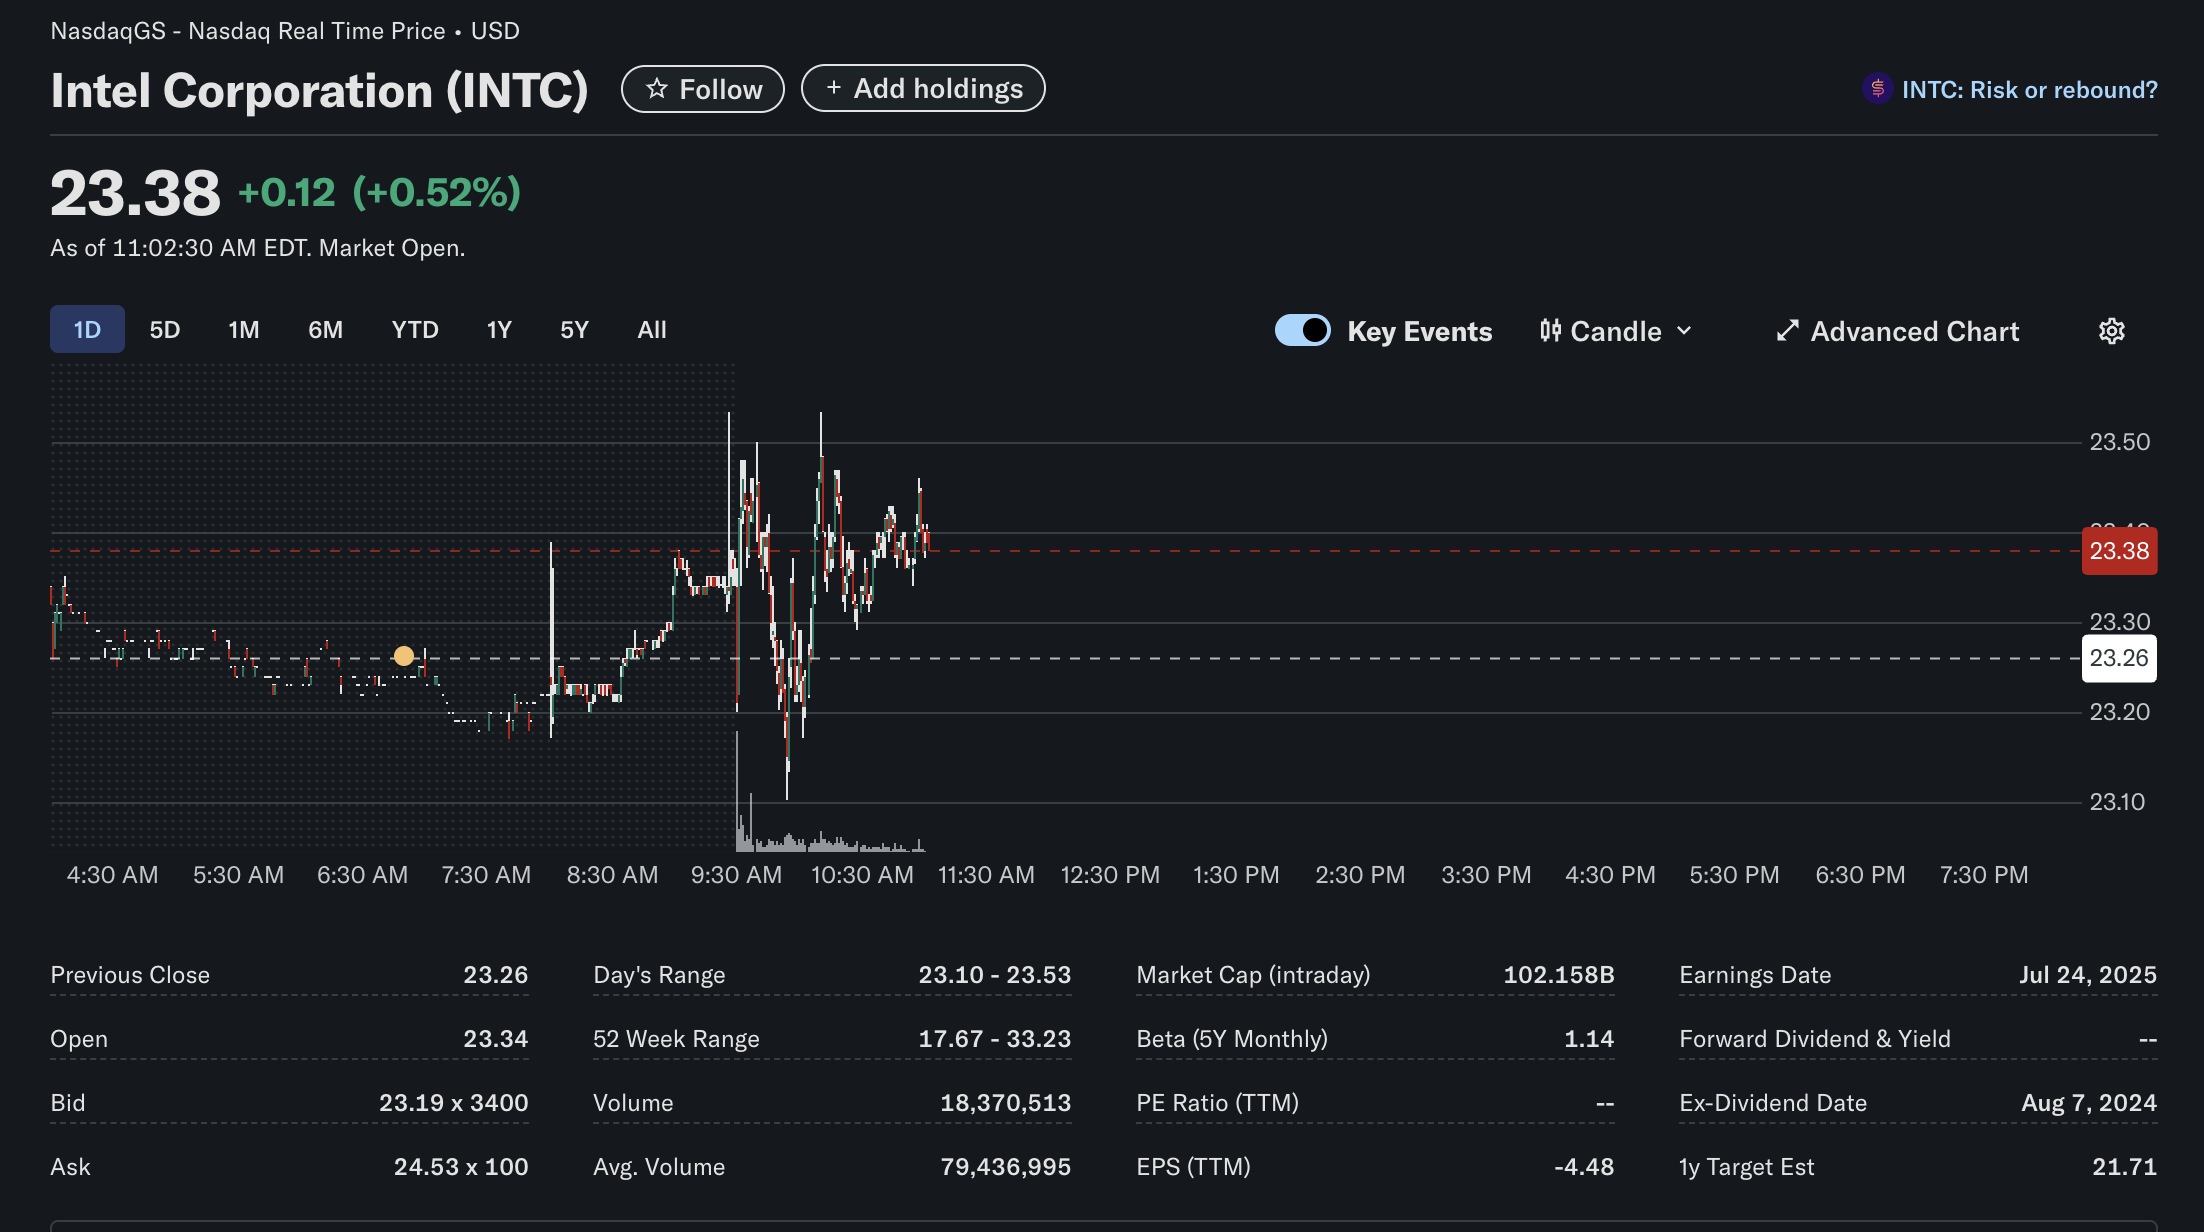
Intel Corporation’s stock is exhibiting significant intraday volatility, with a sharp morning dip followed by a strong recovery. As of 11:02:30 AM EDT, the data presents a complex picture, prompting the key question: Is this a risk or a rebound?
Intel (Ticker: INTC), a cornerstone of the semiconductor industry, is trading at 0.12 (+0.52%) for the session. However, this small green number belies a turbulent morning of trading. This analysis breaks down the technical action, fundamental data, and overall market sentiment surrounding the chip giant.
Disclaimer: This article is for informational purposes only and is based on a single snapshot of market data. It should not be considered financial advice. Investors should conduct their own research and consult with a financial professional before making any investment decisions.
Technical Analysis: A Story of a Rebound
The 1-day candlestick chart reveals a dramatic intraday narrative for Intel’s stock:
-
Sharp Opening Sell-off: The session began with a significant drop right at the market open (9:30 AM), sending the stock to its daily low of $23.10. This move was accompanied by a large spike in trading volume, indicating a moment of intense selling pressure.
-
V-Shaped Recovery: Following the initial plunge, buyers stepped in assertively, driving the price back up. This strong rebound pushed the stock past its previous day’s close of $23.26, turning the session’s performance positive.
-
Key Levels: The day’s high is currently $23.53, which now serves as the immediate resistance level. The morning low of $23.10 has established itself as a critical support level for the day.
-
Current Trend: The stock is consolidating its gains after the sharp recovery. The bullish rebound from the lows is a positive technical signal for the short term, though the initial volatility suggests an ongoing battle between buyers and sellers.
Fundamental Analysis: A Picture of Caution
While the technicals show a daily fight, the fundamental data points to longer-term challenges:
-
Market Capitalization: Intel boasts a massive market cap of $102.158 billion, confirming its status as a major industry leader.
-
Profitability Concerns: This is the most striking area of the fundamental data.
-
The P/E Ratio (TTM) is not available (“–“), which typically indicates that the company has had negative earnings over the trailing twelve months.
-
This is confirmed by the EPS (TTM) of -4.48, showing a significant net loss per share. This lack of recent profitability is a major point of concern for investors.
-
-
Dividend: The “Forward Dividend & Yield” is also marked as “–“. For a company that was historically known as a dividend payer, the absence of a forward dividend suggests a strategic shift, likely to preserve capital for reinvestment or to navigate its current financial turnaround.
-
Analyst Outlook: The 1-year Target Estimate is $21.71. This is a critical and bearish indicator. The consensus analyst target is significantly below the current trading price of $23.38, suggesting that Wall Street analysts, on average, anticipate the stock will fall over the next 12 months.
-
Volatility: The stock’s Beta (5Y Monthly) is 1.14, indicating it is slightly more volatile than the broader market.
Sentiment Analysis: A Divided Market
The sentiment surrounding Intel appears to be split between short-term optimism and long-term caution:
-
Bullish Intraday Sentiment: The powerful V-shaped recovery from the morning lows indicates that there is a strong contingent of buyers who view the stock as undervalued at those levels. The stock being in the green reflects this positive short-term momentum.
-
Bearish Underlying Sentiment: The fundamental data, particularly the negative EPS and the analyst target of $21.71, points to a deeply cautious, if not bearish, long-term sentiment. The platform’s own prompt, “INTC: Risk or rebound?”, perfectly encapsulates this market uncertainty. The lack of a dividend may also deter income-oriented investors.
In conclusion, Intel’s stock is at a fascinating crossroads. While day traders and short-term bulls are celebrating a strong rebound from the session’s lows, the underlying fundamental data and long-term analyst forecasts paint a much more challenging picture. The current price action reflects a classic market debate: whether today’s strength is the start of a sustainable rebound or simply a volatile upswing in a broader, more difficult trend.