Based on data from 10:52 AM EDT, Ford Motor Company’s stock is showing significant intraday weakness, prompting questions about its short-term direction. This analysis provides a breakdown of the technical, fundamental, and sentiment indicators visible in the provided market data.
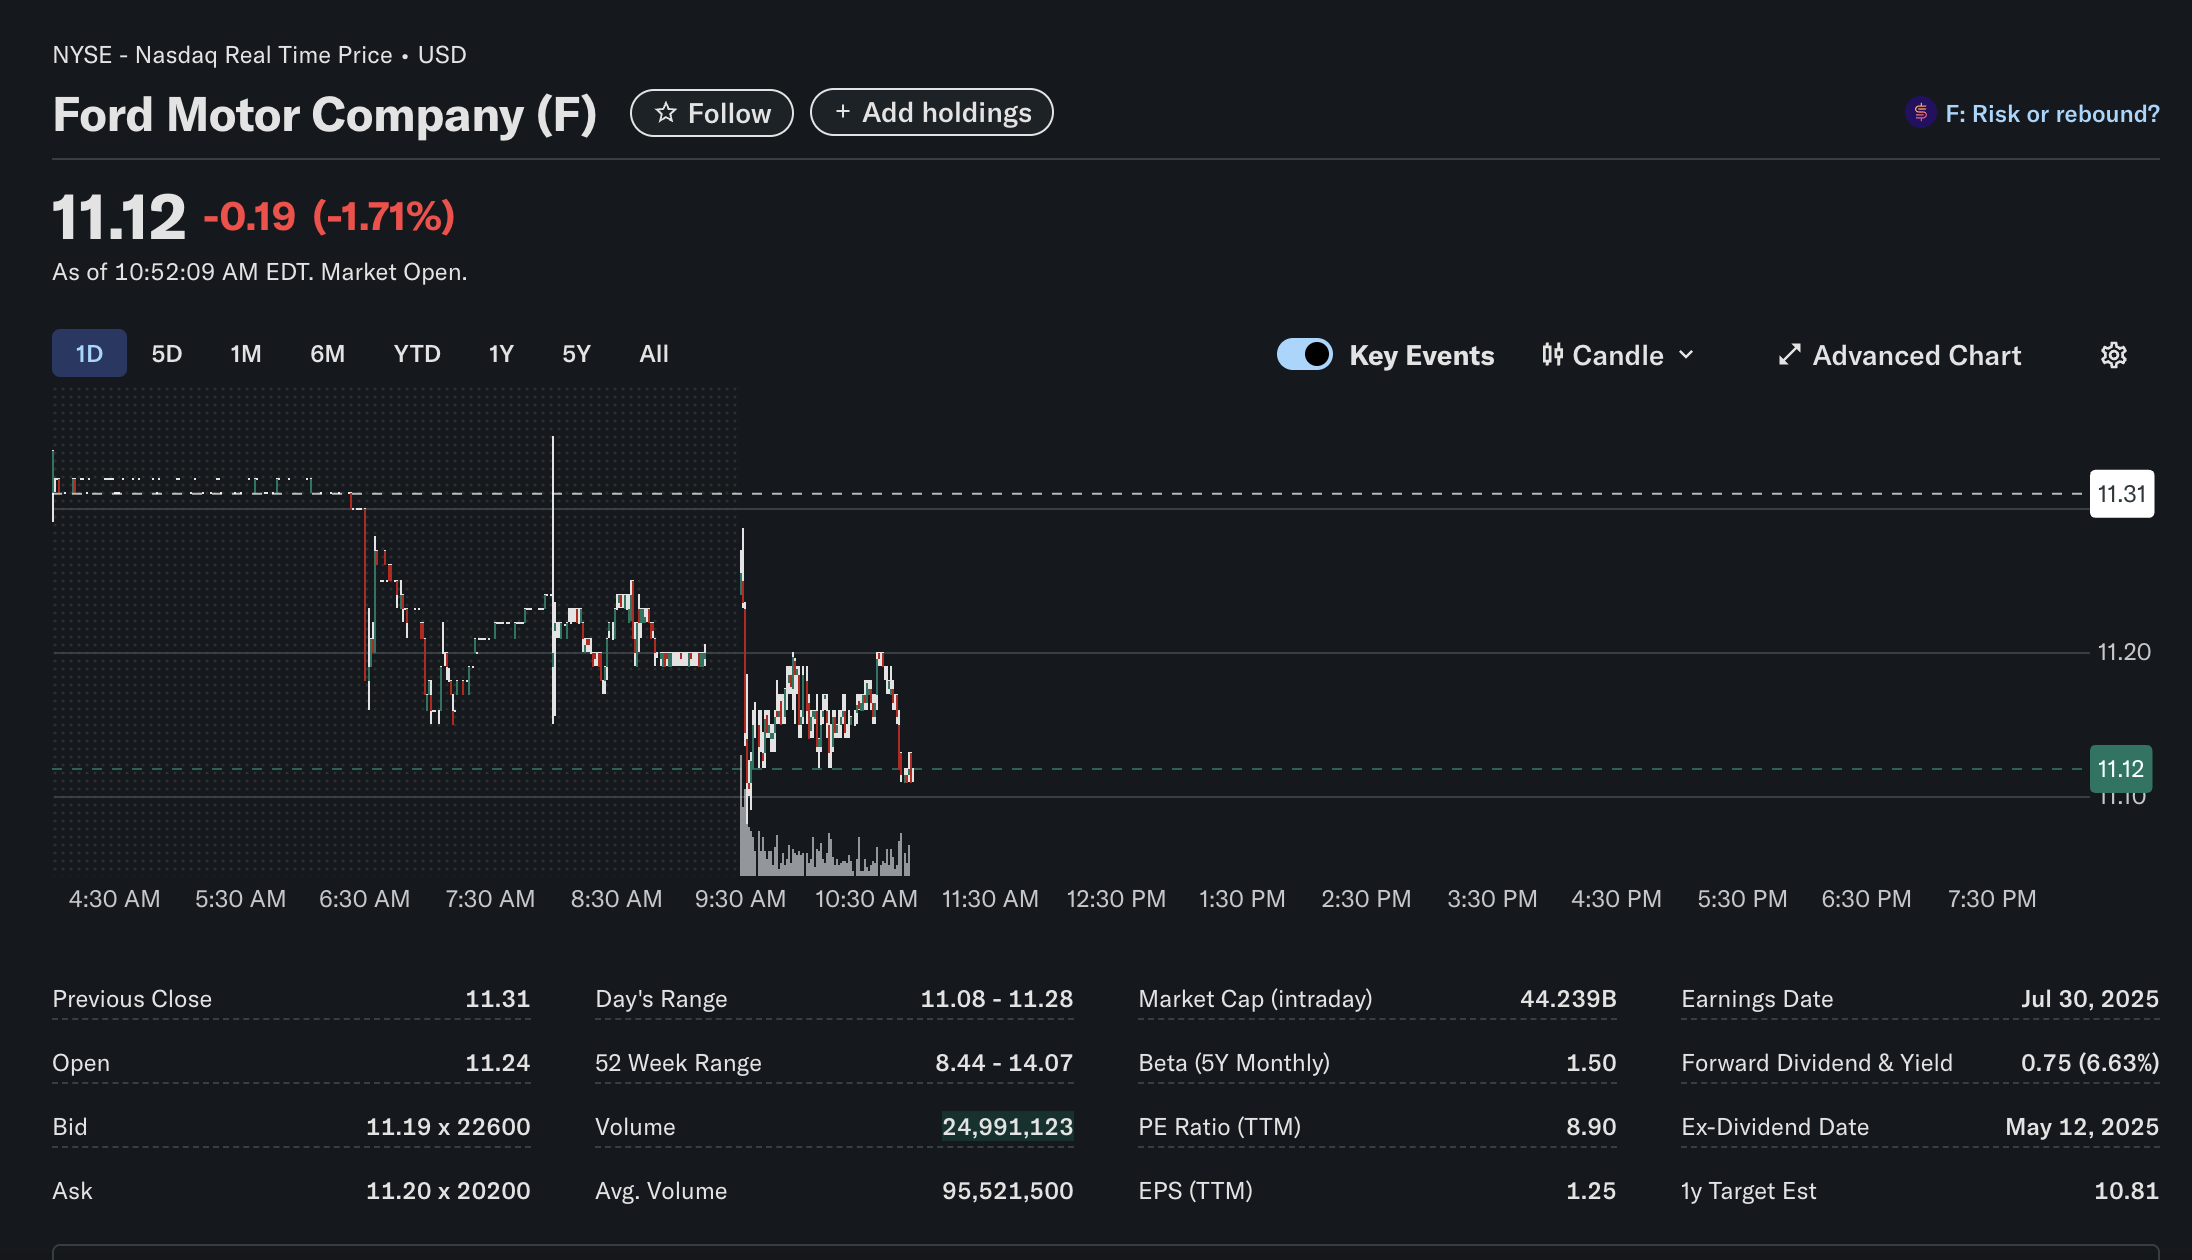
Ford Motor Company (Ticker: F) experienced a notable downturn in early trading, with its stock price at 0.19 or -1.71% for the session. The data, captured as of 10:52 AM EDT while the market was open, reveals a stock grappling with selling pressure. Below is a comprehensive look at what the charts and figures suggest.
Disclaimer: This article is for informational purposes only and is based on a single snapshot of market data. It should not be considered financial advice. Investors should conduct their own research before making any investment decisions.
Technical Analysis: A Bearish Intraday Picture
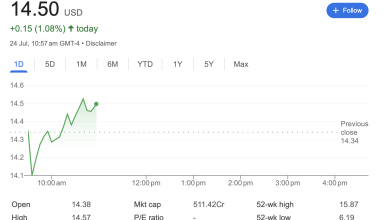
The intraday 1-day chart provides a clear visual of the session’s trading activity:
-
Sharp Opening Drop: After trading flat around the previous day’s close of $11.31 in the pre-market session, Ford’s stock saw a steep sell-off immediately at the 9:30 AM market open.
-
Volume Spike: Corresponding with the sharp price drop, the volume chart at the bottom shows a significant spike, indicating strong selling conviction at the start of the trading day.
-
Key Price Levels: The stock is currently trading well below the previous close of 11.08**, serving as the immediate support level that traders are watching.
-
Current Trend: The price action since the open has been a consolidation at these lower levels, suggesting that while the initial heavy selling has subsided, buyers have not yet stepped in with enough force to reverse the trend. The overall intraday technical outlook appears bearish.
Fundamental Analysis: A Mix of Value and Caution
The fundamental data listed below the chart offers a broader context for the company’s valuation and financial health:
-
Market Capitalization: With a market cap of $44.239 billion, Ford remains a prominent large-cap company in the automotive industry.
-
Valuation Metrics: The Price-to-Earnings (P/E) ratio (TTM) is 8.90, which is relatively low compared to the broader market. A low P/E can sometimes suggest a stock is undervalued, but it can also reflect market concerns about future earnings potential. The Earnings Per Share (EPS) (TTM) stands at 1.25.
-
Dividend Yield: Ford offers a substantial forward dividend and yield of $0.75 (6.63%). This high yield is attractive to income-focused investors but can also indicate that the market perceives a higher level of risk, as a falling stock price increases the yield percentage.
-
Analyst Outlook: The 1-year target estimate is listed as $10.81. This is a critical piece of information, as the analyst consensus target is currently below the stock’s trading price of $11.12, suggesting a cautious or bearish long-term outlook from market analysts.
-
Volatility: The stock’s Beta (5Y Monthly) is 1.50, which indicates that Ford’s stock is historically 50% more volatile than the overall market (represented by a Beta of 1.0).
Sentiment Analysis: Caution Prevails
Market sentiment reflects the overall mood of investors, and several clues point towards a cautious or negative feeling surrounding the stock today:
-
Negative Price Action: The -1.71% decline is a direct reflection of negative sentiment, with sellers outnumbering buyers.
-
“Risk or rebound?”: The financial platform itself highlights this question, indicating that the stock is at a pivotal point where market participants are uncertain about its next move.
-
Analyst Target: As mentioned, the 1-year target estimate being below the current price suggests that professional analysts are not forecasting a significant upward move in the near future.
-
Volume Pattern: The high volume on the opening sell-off confirms that there was a strong, shared sentiment to sell the stock at the beginning of the session.
In summary, the provided snapshot of Ford’s stock shows a company facing significant headwinds during the trading day. While fundamental metrics like a high dividend yield and low P/E ratio might appeal to value investors, the bearish technical signals, high volatility, and cautious analyst estimates paint a picture of prevailing market uncertainty.