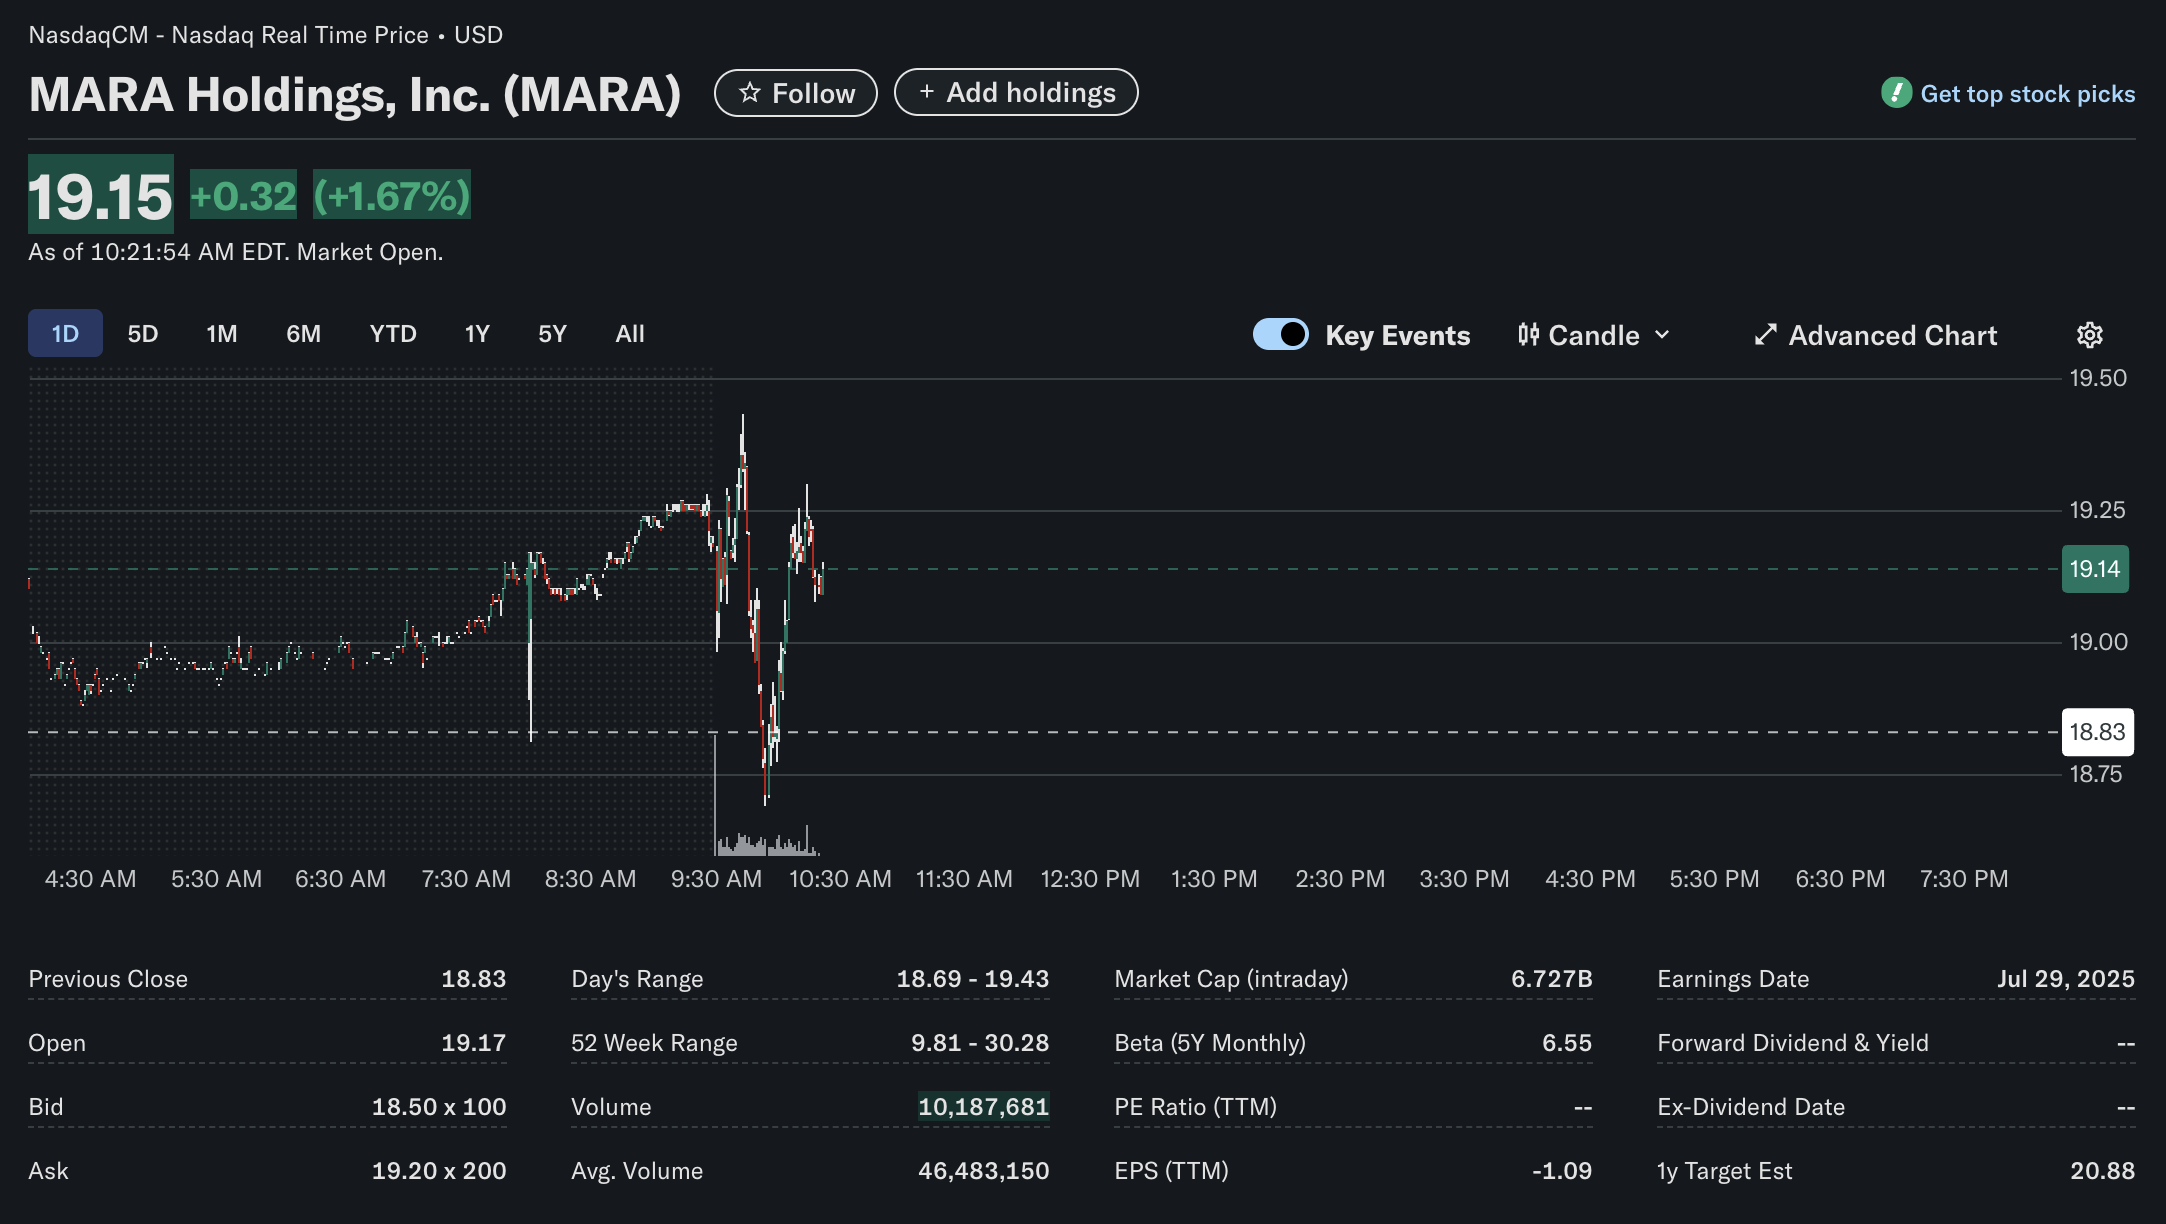
MARA Holdings, Inc. (Nasdaq: MARA), a prominent player in the Bitcoin mining industry, is experiencing a highly volatile trading session. As of 10:21 AM EDT, the stock was trading at 0.32 (+1.67%), demonstrating early strength after a tumultuous market open. This report provides a detailed analysis of the stock’s technical, fundamental, and sentiment indicators.
Technical Analysis
The intraday candlestick chart for MARA showcases the extreme volatility characteristic of the stock and its sector.
-
Intraday Price Action: After a steady climb in pre-market trading, the stock saw a dramatic price swing precisely at the market open (9:30 AM). It plunged sharply to its day’s low of 19.43 within minutes. Since this initial “whipsaw” action, the price has been consolidating around the $19.15 level.
-
Key Levels:
-
Support: The day’s low at $18.69 has established a strong immediate support level.
-
Resistance: The day’s high at $19.43 is the immediate resistance to watch.
-
Previous Close: The stock opened above its previous close of $18.83, a bullish sign that was immediately tested and defended.
-
-
Volume: With over 10.1 million shares traded by 10:21 AM, there is significant interest in the stock. While this is currently tracking below the average volume of 46.48 million, it represents substantial activity for the first hour of trading.
Fundamental Analysis
The fundamental data points provide context for MARA’s valuation and its position as a high-growth, speculative investment.
-
Company Profile: MARA Holdings is a digital asset technology company focused on mining cryptocurrencies, primarily Bitcoin. Its stock performance is often highly correlated with the price movements of Bitcoin.
-
Valuation & Earnings:
-
Market Cap (Intraday): $6.727 Billion, placing it among the larger companies in the crypto mining space.
-
EPS (TTM): The Earnings Per Share for the trailing twelve months is -$1.09, indicating the company is not currently profitable on a net basis.
-
P/E Ratio (TTM): Not applicable, which is common for companies with negative earnings.
-
-
Performance & Outlook:
-
52-Week Range: The stock has traded between $9.81 and $30.28 over the past year. The current price of $19.15 sits in the middle of this range.
-
1y Target Est: Analyst consensus places a one-year target estimate at $20.88, suggesting a modest potential upside from the current price.
-
Dividend: MARA does not pay a dividend, which is typical for growth-oriented companies that reinvest capital back into operations.
-
Sentiment Analysis
Sentiment surrounding MARA is heavily influenced by its volatility and its link to the crypto market.
-
Volatility (Beta): The stock has an extremely high Beta of 6.55. This indicates it is theoretically over six times more volatile than the broader market, making it a favorite among traders seeking significant price swings but also signaling very high risk.
-
Intraday Sentiment: The powerful V-shaped recovery at the market open demonstrates strong bullish sentiment. Despite an initial attempt by sellers to push the price down, buyers stepped in with force, indicating a “buy the dip” mentality is prevalent among its traders and investors.
-
Analyst Sentiment: The 1-year target estimate of $20.88, while not aggressively bullish, indicates that analysts, on average, see positive momentum for the stock over the next year. The overall sentiment is speculative but leans positive, driven by the underlying potential of the digital asset market.
Disclaimer: This article is for informational purposes only and is based on the analysis of the provided image. It should not be considered financial advice. All investment decisions should be made with the consultation of a qualified financial professional.