Understanding Uber Technologies Inc. Stock Performance: A Daily Snapshot
Analyzing the Day's Movement and Key Metrics
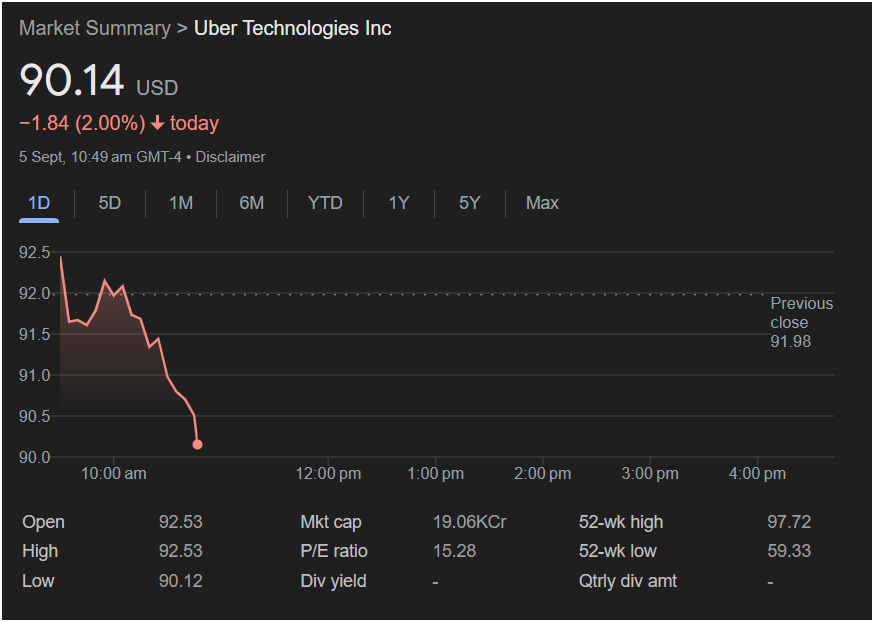
The provided image offers a single-day snapshot of Uber Technologies Inc. (UBER) stock performance, capturing its movement on September 5th, with data as of 10:49 am GMT-4. At this point, the stock is trading at 90.14 USD, reflecting a decrease of 1.84 (2.00%) for the day. This immediate decline is highlighted by the red text and downward arrow next to the price.
Looking at the intraday chart, we can observe the stock’s trajectory from the market open. The graph illustrates a clear downward trend from its earlier highs in the morning towards the 10:49 am mark. The “Previous close” is noted at 91.98, indicating the stock ended the prior trading day at this value. This suggests that the current trading price represents a drop from the previous day’s closing.
Below the chart, several key financial metrics provide further context. The “Open” price for the day was 92.53, which is the price at which the first trade of the day occurred. The “High” for the day, so far, has been 92.53, matching the open, suggesting the stock started at its peak for this period and then began its descent. Conversely, the “Low” for the day, up to this point, is 90.12, which is very close to the current trading price, indicating it’s hovering near its lowest point so far in the trading session.
Other important metrics include:
-
Mkt cap (Market capitalization): 19.06KCr. This figure represents the total value of Uber’s outstanding shares, indicating its size in the market. “KCr” likely stands for “Thousand Crores,” a unit commonly used in some regions, signifying a very large market capitalization.
-
P/E ratio (Price-to-Earnings ratio): 15.28. This ratio is a fundamental valuation metric that compares the company’s current share price to its per-share earnings. A P/E ratio of 15.28 suggests investors are willing to pay 15.28 times the company’s earnings for each share. This figure is often compared to industry averages and the company’s historical P/E to assess if the stock is undervalued or overvalued.
-
Div yield (Dividend yield): –. The dash indicates that Uber does not currently pay a dividend to its shareholders. This is common for growth-oriented companies that prefer to reinvest their earnings back into the business rather than distributing them to shareholders.
-
Qtrly div amt (Quarterly dividend amount): –. As there is no dividend yield, there is no quarterly dividend amount.
-
52-wk high: 97.72. This is the highest price the stock has reached in the past 52 weeks (one year).
-
52-wk low: 59.33. This is the lowest price the stock has reached in the past 52 weeks.
Comparing the current price of 90.14 USD to its 52-week high and low provides perspective on its performance over a broader period. It is currently closer to its 52-week high than its 52-week low, suggesting it has performed relatively well over the past year, even with the current daily dip.
The navigation tabs at the top of the chart (1D, 5D, 1M, 6M, YTD, 1Y, 5Y, Max) indicate the ability to view the stock’s performance over different timeframes. The current view is set to “1D” (1 Day), focusing solely on the day’s activity. Changing these tabs would reveal different trends and historical data, offering a more comprehensive understanding of Uber’s stock trajectory.
The “Disclaimer” link suggests that the data presented is subject to terms and conditions and should not be taken as financial advice without further due diligence. Financial markets are dynamic, and past performance is not indicative of future results.
In summary, this image provides a clear and concise snapshot of Uber’s stock performance on a specific morning, highlighting a downward movement from its opening price. While it offers valuable immediate insights, a complete understanding would require analyzing trends over longer periods and considering broader market conditions, company news, and industry developments.