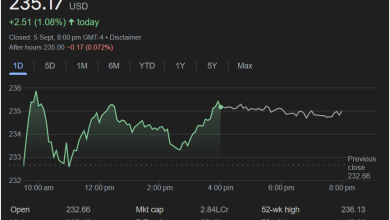
Analyzing Palantir Technologies Inc. Daily Stock Performance
A Snapshot of Market Activity on September 5th
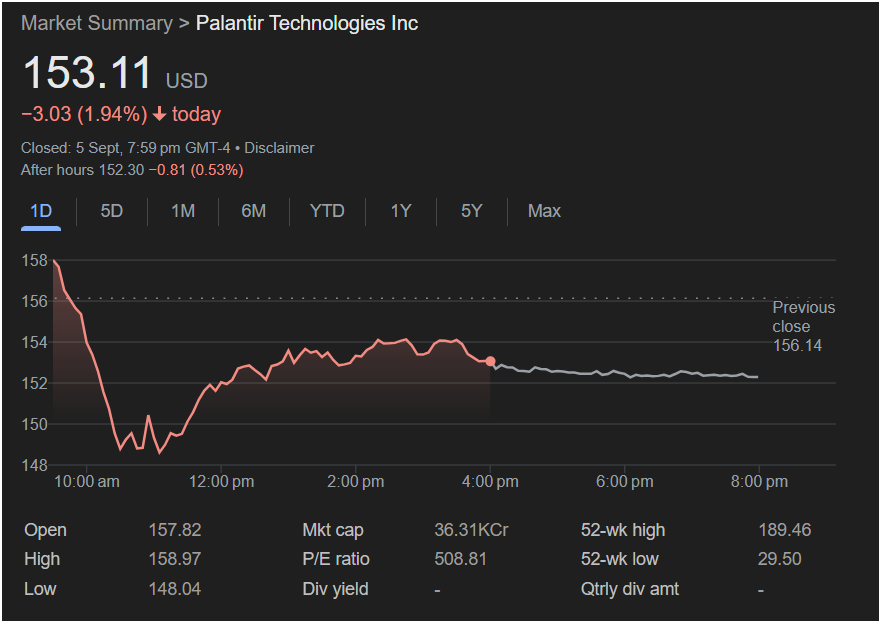
The image displays a “Market Summary” for Palantir Technologies Inc. (PLTR) showing its performance for a single day, September 5th.
Key Data Points at the Top:
-
153.11 USD: This is the closing price of Palantir stock on September 5th.
-
-3.03 (1.94%) today: This indicates that the stock price decreased by $3.03, which is a 1.94% drop, during the trading day of September 5th. This is highlighted in red, signifying a loss.
-
Closed: 5 Sept, 7:59 pm GMT-4: This confirms the closing date and time according to the specified time zone.
-
After hours 152.30 -0.81 (0.53%): This shows that in after-hours trading, the stock continued to decline, dropping by an additional $0.81, or 0.53%. This suggests continued negative sentiment after the regular market close.
The Stock Chart (1D View):
The main part of the image is a line graph showing the “1D” (1-day) performance of PLTR.
-
Y-axis (Price): The vertical axis ranges from approximately $148 to $158, representing the stock price in USD.
-
X-axis (Time): The horizontal axis shows the time of day, starting around 10:00 am and going up to 8:00 pm.
-
The Line Graph: The red and gray line illustrates the price fluctuations throughout the day.
-
Morning Decline: The stock opened significantly higher, near $158, and experienced a sharp drop in the morning hours, hitting its daily low around $148. This initial plunge indicates significant selling pressure early in the trading day.
-
Mid-day Recovery: After hitting its low, the stock showed some recovery, gradually climbing back up towards the
155 range by early afternoon (around 2:00 pm – 3:00 pm). This suggests that some buyers stepped in, seeing value at the lower prices, or that the initial selling pressure subsided.
-
Afternoon Consolidation/Slight Decline: From late afternoon onwards (around 4:00 pm), the stock appears to consolidate or experience a slight, more gradual decline, hovering in the
153 range until the close of the regular market. The gray portion of the line shows the after-hours trading, where the price continues to trend slightly downwards.
-
-
Previous close 156.14: This crucial data point, shown on the right side of the chart, tells us the closing price of Palantir stock on the day before September 5th. Comparing the opening price on September 5th (
156.14), we can infer a gap up at the open, meaning the stock opened higher than it closed the day before.
Detailed Metrics at the Bottom:
-
Open: 157.82: The price at which the stock started trading on September 5th. As noted, this was higher than the previous day’s close.
-
High: 158.97: The highest price the stock reached during the trading day.
-
Low: 148.04: The lowest price the stock touched during the trading day. This represents a significant intraday price swing from the high.
-
Mkt cap: 36.31KCr: This stands for Market Capitalization, which is the total value of all outstanding shares. “KCr” likely means “Thousand Crores” (a Crore is 10 million), indicating a very large market cap. In standard Western financial terms, this would typically be expressed in billions or trillions. Assuming “KCr” refers to 36.31 Trillion in a specific regional context or is an abbreviation for something else like a local currency, it signifies a very large company. If “KCr” means 36.31 * 10^10, then that would be 363.1 billion. More likely, “KCr” is a placeholder for a large number which in a Western context would be displayed as something like 36.31B (Billion).
-
P/E ratio: 508.81: The Price-to-Earnings ratio. A very high P/E ratio like this suggests that investors are willing to pay a premium for Palantir’s earnings, often due to high growth expectations or the perception of future profitability. It indicates the stock is trading at a significant multiple of its trailing twelve-month earnings per share.
-
Div yield: -: This indicates that Palantir does not currently pay a dividend to its shareholders. This is common for growth companies that reinvest their earnings back into the business.
-
52-wk high: 189.46: The highest price the stock has reached in the last 52 weeks. The current price of $153.11 is well below this high.
-
52-wk low: 29.50: The lowest price the stock has reached in the last 52 weeks. The current price is significantly above this low, suggesting substantial growth over the past year.
-
Qtrly div amt: -: Reinforces that there is no quarterly dividend amount.
Interpreting the Day’s Performance:
On September 5th, Palantir experienced a volatile trading day characterized by an initial rally (opening higher than the previous close) followed by a sharp sell-off in the morning, a recovery in the afternoon, and then a consolidation with a slight downtrend into after-hours trading. The overall sentiment for the day was negative, with the stock closing down almost 2%.
The substantial drop from the open to the daily low, followed by a partial recovery, suggests a battle between buyers and sellers. The initial high valuation (P/E ratio of 508.81) and the distance from its 52-week high, yet significant increase from its 52-week low, position Palantir as a stock with high investor expectations and considerable past growth.
Further Considerations (without drawing conclusions):
To provide a deeper analysis, one would typically look at:
-
Volume: High trading volume during significant price movements (especially the morning drop) would indicate strong conviction behind those moves.
-
News/Events: Any company-specific news (earnings reports, contract wins/losses, analyst ratings) or broader market news (economic data, interest rate changes) that could have influenced investor sentiment on that particular day.
-
Sector Performance: How other technology or software stocks performed on the same day.
-
Technical Indicators: Other chart patterns, moving averages, or relative strength index (RSI) that could provide insights into momentum and potential future direction.
The image provides a snapshot of Palantir’s daily stock activity, highlighting its intraday volatility and the overall bearish sentiment on September 5th. It also gives us a clear picture of its valuation metrics and its performance range over the past year.
This analysis focuses purely on the data presented. If you have specific questions about any of these elements or would like me to elaborate on a particular aspect, please let me know!
If you’d like to visualize any specific aspect of this data, for example, a chart showing the percentage change from open to close, I can generate an image for that.