Analyzing Alphabet Inc. Class C Stock Performance: A Day in the Life
Exploring the Dynamics of GOOG Stock on a Specific Trading Day
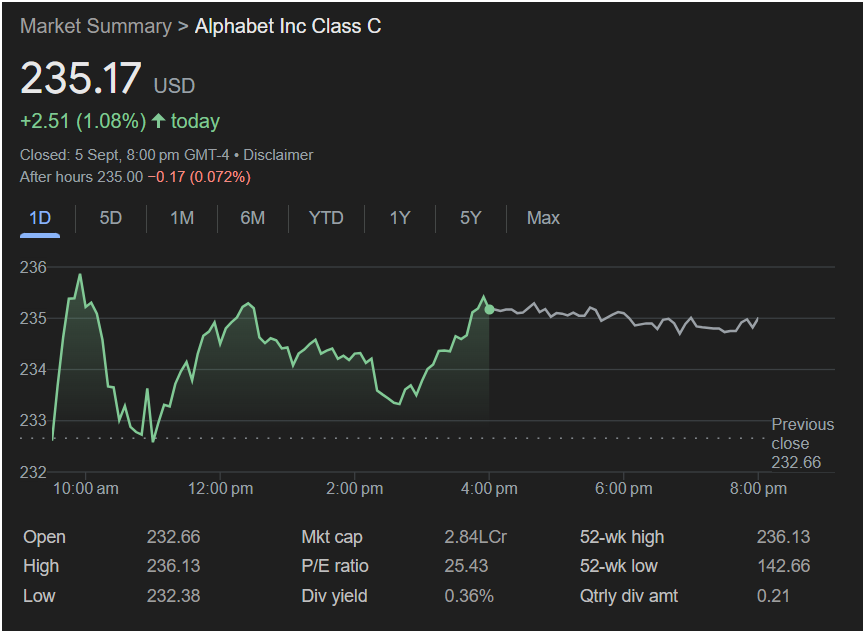
The provided image offers a snapshot of Alphabet Inc. Class C (GOOG) stock performance on a particular trading day, specifically September 5th, closing at 8:00 pm GMT-4. At first glance, the stock closed at 235.17 USD, marking a gain of 2.51 USD or 1.08% for the day. This immediate data point suggests a positive sentiment surrounding the stock during this period. However, delving deeper into the accompanying chart and financial metrics reveals a more nuanced picture of market activity and the underlying factors influencing GOOG’s valuation.
The intraday chart, spanning from 10:00 am to 8:00 pm, illustrates a dynamic journey for GOOG stock. It opened at 232.66 USD and experienced fluctuations throughout the day. We observe an initial dip in the morning, followed by a recovery and a relatively strong performance in the afternoon, peaking around the 4:00 pm mark. The stock then settles slightly lower towards the close. This pattern of ebb and flow is typical in stock market trading, reflecting continuous reactions to various market news, investor sentiment, and broader economic indicators.
Key metrics presented alongside the chart provide additional context. The “Mkt cap” (Market capitalization) stands at 2.84L Cr, a substantial figure that underscores Alphabet’s position as a technology giant. The “P/E ratio” (Price-to-Earnings ratio) is 25.43, a valuation multiple that investors often use to compare the company’s stock price to its per-share earnings. A P/E ratio of 25.43 suggests that investors are willing to pay 25.43 times the company’s annual earnings per share. This ratio, when compared to industry averages or historical P/E ratios for Alphabet, could indicate whether the stock is considered undervalued, fairly valued, or overvalued by the market at this specific point.
The “Div yield” (Dividend yield) is reported as 0.36%, with a “Qtrly div amt” (Quarterly dividend amount) of 0.21. This indicates that Alphabet does pay a dividend to its shareholders, albeit a relatively modest one compared to some other companies. For income-focused investors, the dividend yield is a crucial metric, reflecting the return on investment from dividends alone.
The 52-week high and low figures, 236.13 and 142.66 respectively, provide a broader historical context. The day’s high of 236.13 USD is very close to the 52-week high, suggesting that the stock was trading near its peak performance for the past year on this particular day. Conversely, the 52-week low of 142.66 USD highlights the range of volatility the stock has experienced over a longer period. Comparing the current price to these extremes can offer insights into the stock’s current momentum and potential for further appreciation or depreciation.
The “After hours” trading information, showing a slight dip of 0.17 USD (0.072%) after the official market close, indicates continued activity and investor reactions even outside of regular trading hours. After-hours trading can be influenced by late-breaking news or initial reactions to earnings reports, though it often involves lower trading volumes.
To fully understand the implications of this single day’s performance, one would need to consider a multitude of external factors. For instance, what news or analyst reports were released on or around September 5th that might have influenced investor behavior? Were there any broader market trends, such as shifts in the technology sector, that played a role? How did key economic indicators, such as inflation rates or interest rate expectations, affect investor confidence in growth stocks like Alphabet?
Furthermore, a detailed analysis would involve comparing Alphabet’s performance to its competitors, such as other major technology companies. Did other large-cap tech stocks experience similar gains or losses on this day? Such comparisons can help determine whether GOOG’s movement was company-specific or part of a larger market trend.
Beyond the immediate financial metrics, an exploration of Alphabet’s underlying business fundamentals would be essential. This includes examining the performance of its various segments, such as Google Search, YouTube, Google Cloud, and its “Other Bets.” Strong growth in one or more of these areas could be a primary driver of investor confidence and stock price appreciation. Conversely, challenges or slowdowns in key business units could exert downward pressure.
The long-term outlook for Alphabet also plays a significant role in how investors perceive its daily fluctuations. Factors like innovation in artificial intelligence, expansion into new markets, regulatory environments, and the competitive landscape all contribute to the company’s future prospects and, consequently, its stock valuation. A positive long-term narrative can often cushion the impact of short-term market volatility.
Considering the global nature of Alphabet’s operations, geopolitical events, international economic conditions, and currency fluctuations could also have an impact. For a company with such a vast global footprint, events in one region of the world can ripple across its operations and financial performance.
Finally, the psychology of the market is an undeniable factor. Investor sentiment, driven by fear and greed, often leads to irrational exuberance or panic selling. While the provided data offers a quantitative view, understanding the qualitative aspects of market psychology on September 5th would provide a more complete picture. Were investors particularly optimistic about the tech sector that day, or were there specific catalysts that made GOOG an attractive buy?
while the image presents a clear and concise summary of Alphabet Inc. Class C stock performance on a single day, it serves as a starting point for a much broader inquiry. The 1.08% gain and the specific intraday movements are outcomes of a complex interplay of internal company fundamentals, external market forces, economic conditions, and investor sentiment. A comprehensive understanding requires moving beyond these immediate figures to explore the myriad factors that continuously shape the valuation of a company as significant as Alphabet.