A Glimpse into Microsoft’s Recent Market Performance
Analyzing Key Metrics from the Daily Stock Summary
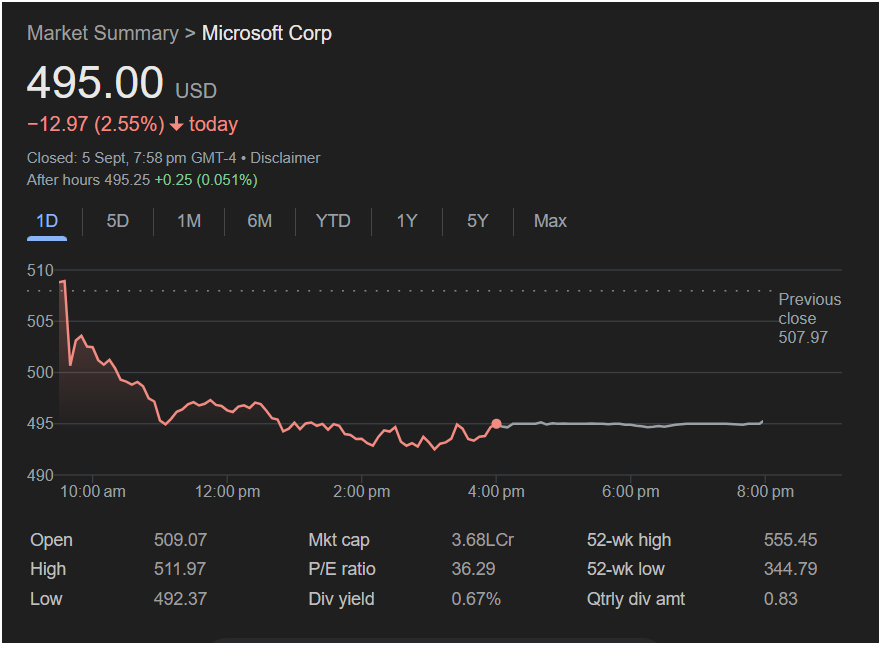
The image displays the market activity for Microsoft Corp (MSFT) for a single day, presumably September 5th, based on the “Closed: 5 Sept, 7:58 pm GMT-4” timestamp.
Key Observations:
-
Stock Price: Microsoft closed at $495.00 USD.
-
Daily Change: The stock was down by $12.97 (2.55%) for the day. This indicates a negative day for Microsoft’s stock performance.
-
After Hours Trading: After hours, the stock saw a slight increase of $0.25 (0.051%), reaching $495.25.
-
Trading Range (Graph): The graph visually represents the stock’s movement throughout the day, starting above $505 and generally trending downwards, stabilizing around $495 in the later hours. The “Previous close” is indicated around $507.97, aligning with the day’s decline.
-
Daily Statistics:
-
Open: $509.07
-
High: $511.97
-
Low: $492.37
-
Mkt cap (Market Capitalization): 3.68L Cr (This likely means 3.68 Lakh Crore, which would be a very large number, suggesting this is a localized representation for market cap, perhaps from an Indian financial platform, translating to trillions of USD. For reference, Microsoft’s market cap is indeed in the trillions of USD).
-
P/E ratio (Price-to-Earnings Ratio): 36.29. This is a common valuation metric, indicating how much investors are willing to pay for each dollar of Microsoft’s earnings.
-
Div yield (Dividend Yield): 0.67%. This represents the annual dividend payment as a percentage of the stock price.
-
Qtrly div amt (Quarterly Dividend Amount): $0.83. This is the amount of dividend paid per share each quarter.
-
52-wk high: $555.45. This is the highest price Microsoft stock has traded at in the past 52 weeks.
-
52-wk low: $344.79. This is the lowest price Microsoft stock has traded at in the past 52 weeks.
-
Interpreting the Data (Without Conclusion):
The data from this single day shows that Microsoft experienced a notable decline in its stock price, dropping from its opening value and its previous close. The daily high and low provide the range within which the stock traded. The market capitalization confirms its status as a colossal company. The P/E ratio, dividend yield, and quarterly dividend amount offer insights into its valuation and investor returns. Comparing the current price to the 52-week high and low gives context on where the stock stands relative to its annual performance extremes.
This summary provides a snapshot of one trading day. To understand Microsoft’s stock performance more comprehensively, one would typically look at trends over longer periods (1M, 6M, YTD, 1Y, 5Y, Max, as indicated by the tabs in the image), industry news, company announcements, and broader economic indicators.
If you have specific questions about any of these metrics or would like me to generate an image related to stock market visualizations, please let me know! I can create a new visual representation if that would be helpful for your open-ended exploration.