A Snapshot of General Electric: Intraday Dynamics and Broader Context
Decoding the Daily Movements and Long-Term Trajectories of a Market Giant
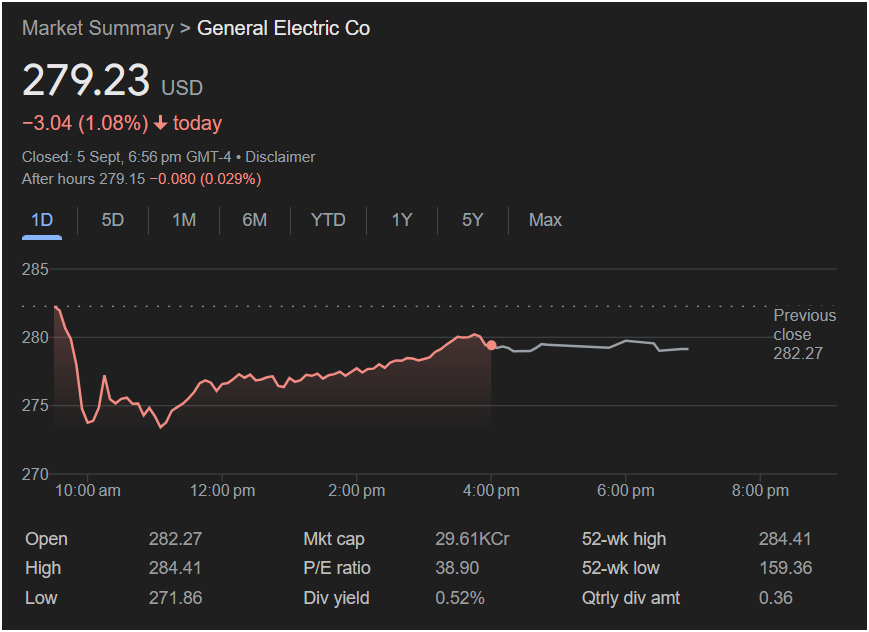
The presented market summary for General Electric Co. (GE) offers a fascinating, albeit brief, glimpse into the stock’s performance on a specific trading day, September 5th, closing at 6:56 pm GMT-4. At first glance, the headline figures immediately draw attention: a closing price of 279.23 USD, reflecting a -3.04 (1.08%) drop on the day. This immediate negative movement prompts a deeper dive into what transpired within that single trading session and how it might fit into the larger narrative of GE’s ongoing transformation.
The intraday chart, spanning from 10:00 am to just past 8:00 pm, meticulously tracks the stock’s fluctuations. It opens with a value close to the Previous close of 282.27, which also happens to be the day’s Open price. This suggests a relatively stable start, aligning with the previous day’s closing sentiment. However, the subsequent hours reveal a clear downward trend in the morning, with the stock dipping significantly, likely touching or closely approaching its Low of 271.86 USD before mid-day. This early decline would undoubtedly have been a point of concern for investors monitoring the stock in real-time.
The recovery observed in the afternoon, pushing the stock back towards the 280 USD mark, indicates a degree of resilience or perhaps a change in market sentiment during later trading hours. This could be attributed to various factors: positive news emerging, short-covering activities, institutional buying, or simply a market correction after an initial overreaction. The flattening out of the curve in the “After hours” trading segment, showing a minimal -0.080 (0.029%) change, suggests a stabilization following the regular market close. The high for the day, 284.41 USD, achieved likely early in the session or during a brief surge, stands as a benchmark of upward potential that wasn’t sustained throughout the entire day.
Analyzing such intraday movements often requires looking beyond the numbers themselves and considering the broader market context. Was the entire market down on September 5th? Were there specific sector-wide pressures affecting industrial conglomerates like GE? Without this external data, it’s challenging to attribute the day’s decline solely to GE-specific news or broader economic trends. For instance, a general market downturn might pull even fundamentally strong stocks lower, while a GE-specific announcement, such as an earnings pre-announcement or a significant contract win or loss, could cause more idiosyncratic movements.
Beyond the daily fluctuations, the summary provides crucial metrics that help position GE within its industry and the wider market. The Market capitalization of 29.61KCr (presumably 29.61 Trillion Indian Rupees, or a similar large currency unit, which would translate to a significant dollar value, suggesting GE remains a substantial entity despite its recent transformations). This immense market cap underscores its status as a major player, meaning its movements can often influence market sentiment for other large-cap industrials.
The P/E ratio of 38.90 is another critical indicator. This metric, standing at nearly 39, suggests that investors are willing to pay a premium for GE’s earnings. A high P/E ratio can imply several things: expectations of strong future growth, the stock being considered a “growth stock” rather than a “value stock,” or potentially, the market viewing its current earnings as depressed but with significant recovery potential. Comparing this P/E to industry averages and historical GE P/E ratios would provide much-needed context. For a company undergoing significant restructuring, as GE has been for several years, a higher P/E might also reflect optimism about the success of its spin-offs (GE HealthCare, GE Vernova) and the focus on its core aviation business. Conversely, it could also signal that the stock is somewhat overvalued if the growth projections do not materialize.
Dividend yield is another point of interest. At 0.52%, with a Qtrly div amt of 0.36, GE’s dividend yield is relatively low compared to what might be expected from a mature industrial company. This lower yield could be a consequence of the company prioritizing reinvestment in its core businesses, deleveraging its balance sheet, or reflecting its ongoing strategic shifts where capital is being allocated towards growth initiatives rather than significant shareholder distributions. For income-focused investors, this yield might not be particularly attractive, signaling that GE is currently viewed more as a growth or turnaround play than a consistent income generator. This contrasts sharply with its historical identity as a “widows and orphans” stock known for reliable dividends. The reduction and eventual reinstatement of its dividend after years of financial challenges underscore the dramatic shifts in its capital allocation strategy.
Looking at the 52-week range provides a broader perspective on the stock’s volatility and investor sentiment over the past year. The 52-wk high of 284.41 USD and 52-wk low of 159.36 USD illustrate a significant price appreciation, with the current price of 279.23 USD sitting very close to its annual high. This suggests a strong bullish trend over the past year, indicating that, despite the daily dip, the longer-term sentiment has been overwhelmingly positive. The difference between the 52-week high and low represents a substantial gain for those who invested near the low, highlighting the potential rewards (and risks) associated with turnaround stories. What drove this impressive rally? Was it the successful execution of its spin-off strategy, improved performance in its aviation segment, or broader investor confidence in its new, streamlined structure? Answering these questions would require examining GE’s financial reports and market news over the last year.
The journey of General Electric has been one of profound transformation. Once a sprawling conglomerate involved in everything from light bulbs to jet engines, GE has undergone a rigorous process of divestitures and spin-offs. The decision to break up into three distinct publicly traded companies – GE HealthCare, GE Vernova (energy), and the remaining GE Aerospace – was a monumental strategic pivot aimed at unlocking shareholder value by allowing each business to focus on its specific markets. The stock performance leading up to and following these announcements and executions is crucial to understanding the current valuation and investor sentiment.
The market summary, while concise, poses more questions than it answers, as any good data point should in an open-ended analysis. For example, what were the trading volumes on this particular day? High volume accompanying a decline could signal strong conviction among sellers, while low volume might suggest a more temporary or less significant dip. How does GE’s performance compare to its direct competitors in the aerospace sector? Is it gaining market share, or are there competitive pressures at play?
Furthermore, the macro-economic environment cannot be ignored. Interest rates, inflation, global supply chain issues, and geopolitical events can all profoundly impact an industrial giant like GE. For instance, rising interest rates can increase borrowing costs for large infrastructure projects, potentially impacting GE Vernova’s future orders, while robust air travel demand directly benefits GE Aerospace. A global economic slowdown could dampen demand across all its segments.
The future outlook for GE Aerospace, now the core of the remaining GE, is intricately linked to the global aviation industry. Post-pandemic recovery in air travel, demand for new, more fuel-efficient aircraft, and defense spending all play critical roles. The long-term contracts for engine maintenance and services provide a stable revenue stream, but the cyclical nature of aircraft orders means volatility can be expected.
The disclaimer about “Closed: 5 Sept, 6:56 pm GMT-4” and “After hours 279.15 -0.080 (0.029%)” also highlights the nuances of market trading. After-hours trading can be less liquid and more volatile, often reacting to news released outside regular market hours. The slight dip after hours might be insignificant, or it could be a precursor to further movement on the next trading day, depending on what, if any, news emerged.
this market summary acts as a single frame in a much larger cinematic narrative of General Electric. It tells a story of intraday volatility, a slight daily decline, but also hints at a powerful longer-term upward trend reflected in its proximity to the 52-week high. The financial metrics like P/E and dividend yield offer clues about how the market currently perceives GE’s value proposition and future growth prospects. However, without additional context – historical performance, competitor analysis, industry trends, and specific news events from September 5th and the preceding year – a definitive conclusion about GE’s trajectory remains elusive. The open-ended nature of this analysis underscores the dynamic and complex interplay of factors that constantly shape the valuation and performance of a company as significant as General Electric. Its journey from a diversified industrial powerhouse to a more focused aerospace entity is a live case study in corporate transformation, with each day’s market summary adding a new data point to its evolving story.