
The T-Mobile stock (TMUS) is experiencing a downward trend in early trading today, catching the attention of traders looking for either a potential shorting opportunity or a discounted entry point. According to market data from June 13th at 10:09 AM GMT-4, the telecommunications giant has slipped, and this article provides a comprehensive breakdown of all the available information for any trader considering a move.
Disclaimer: This article is for informational purposes only and is based on a static market snapshot. It does not constitute financial advice. Stock markets are highly volatile, and you should conduct your own thorough research and consult with a certified financial professional before making any investment decisions.
Part 1: Intraday Price Action and Market Sentiment
The immediate snapshot of T-Mobile’s performance shows a clear bearish sentiment for the morning session.
-
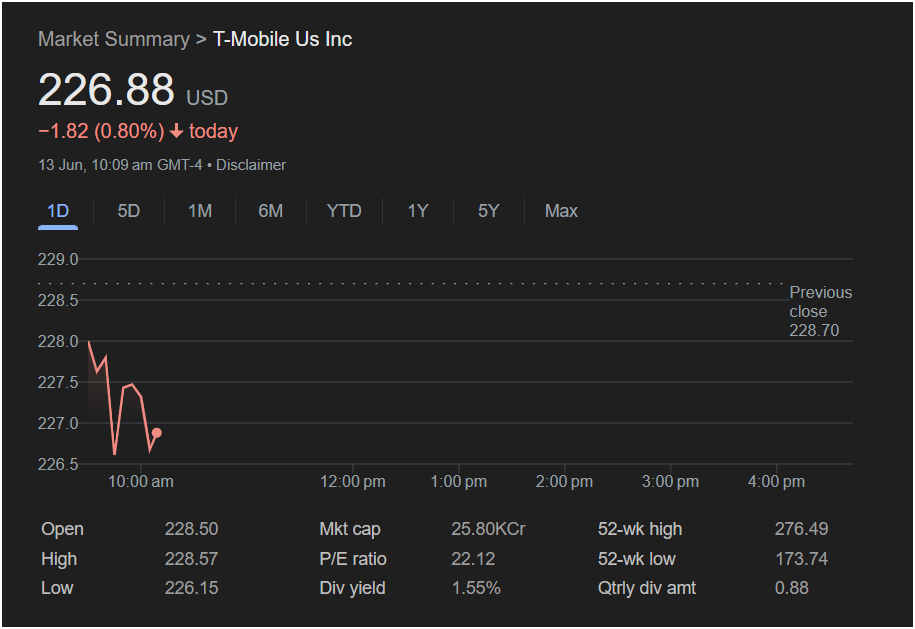
Current Price: 226.88 USD
-
Today’s Change: Down -1.82 (-0.80%)
-
Market Sentiment: The red text and downward arrow signal that sellers are in control.
The 1-day chart reveals a story of early weakness. The stock opened at 228.50, slightly below the previous close of 228.70. It made a brief attempt to rise, hitting a high of 228.57, before facing strong selling pressure that pushed it down to a low of 226.15. The current price is hovering just above this daily low.
 Trader’s Takeaway: This price action is decidedly bearish for the short term. The stock failed to gain any upward momentum from the open and has since broken through its opening price and the previous day’s close, which often act as initial support levels. The key for the rest of the day is whether the 226.15 low will hold as a new support level or if the selling pressure will continue.
Part 2: Unpacking the Financial Metrics
Looking beyond the daily chart, the fundamental data provides a much broader context for T-Mobile’s valuation.
-
P/E Ratio (22.12): This Price-to-Earnings ratio is considered moderate, especially for a large-cap tech-adjacent company. It suggests the stock is not trading at an extreme premium relative to its earnings, which can make it more resilient during market corrections compared to high-P/E stocks.
-
Dividend Yield (1.55%): This is a critical piece of information. Unlike many growth-focused tech companies, T-Mobile pays a dividend. With a quarterly dividend of 0.88 per share, it offers a source of income for investors. This makes the T-Mobile stock attractive to a different class of investors—those seeking a blend of potential growth and regular income.
-
52-Week Range (173.74 – 276.49): The current price of 226.88 sits comfortably within this range. It is significantly above the 52-week low, indicating a strong performance over the past year, but it is also well below the 52-week high. This suggests there could be room for upward movement if market conditions become favorable. The high of 276.49 serves as a long-term resistance target.
-
Market Cap (25.80KCr): This confirms T-Mobile’s status as a large, well-established company in the telecommunications sector.
Part 3: To Invest or Not? A Trader’s Perspective
Based on this data, a trader is presented with conflicting signals between short-term momentum and long-term fundamentals.
The Bearish Case (Reasons for Caution):
-
Strong Downward Momentum: The intraday chart is clearly bearish. Any attempt to buy now is “catching a falling knife” and goes against the current market trend.
-
Break of Support: The stock has fallen below its previous close and opening price, which technical traders see as a sign of weakness.
-
Broader Market Factors: Without knowing the performance of the overall market (like the S&P 500), this drop could be part of a wider market sell-off.
The Bullish Case (Potential for Opportunity):
-
Reasonable Valuation: The P/E ratio of 22.12 suggests the stock isn’t excessively priced, potentially limiting its downside risk compared to more speculative stocks.
-
Dividend Support: The 1.55% dividend yield provides a small cushion and a reason for income investors to buy on dips, which can help establish a support level.
-
Discount from Highs: For an investor with a longer-term horizon, this 0.80% dip represents a small discount on a stock that is still trading well below its 52-week peak.
What a Trader Must Consider Next:
To make an informed decision, a trader must look beyond this single image:
-
Trading Volume: Is the selling happening on high volume? This would confirm the strength of the downtrend.
-
Sector News: Is there any news affecting the telecommunications sector or T-Mobile’s direct competitors (like AT&T or Verizon)?
-
Overall Market Health: A broader market rally could help T-Mobile reverse its course, while a market-wide sell-off would likely drag it down further.
Today, the T-Mobile stock is exhibiting clear short-term bearishness, driven by early selling pressure. However, its fundamentals—a moderate P/E ratio and a steady dividend—present a more stable long-term profile.
For a momentum trader, the current trend is down, and caution is advised. For a value or income-focused investor, this dip could be the beginning of a buying opportunity, provided the stock finds a solid support level. The ultimate decision requires a deeper look at real-time volume, news, and the broader market context.

