
 Goldman Sachs Group Inc (GS) delivered a stellar performance in the last trading session, closing with a significant 2.33% gain. However, a notable dip in pre-market trading is casting a shadow of uncertainty, leaving traders to carefully weigh bullish momentum against potential profit-taking at Monday’s open.
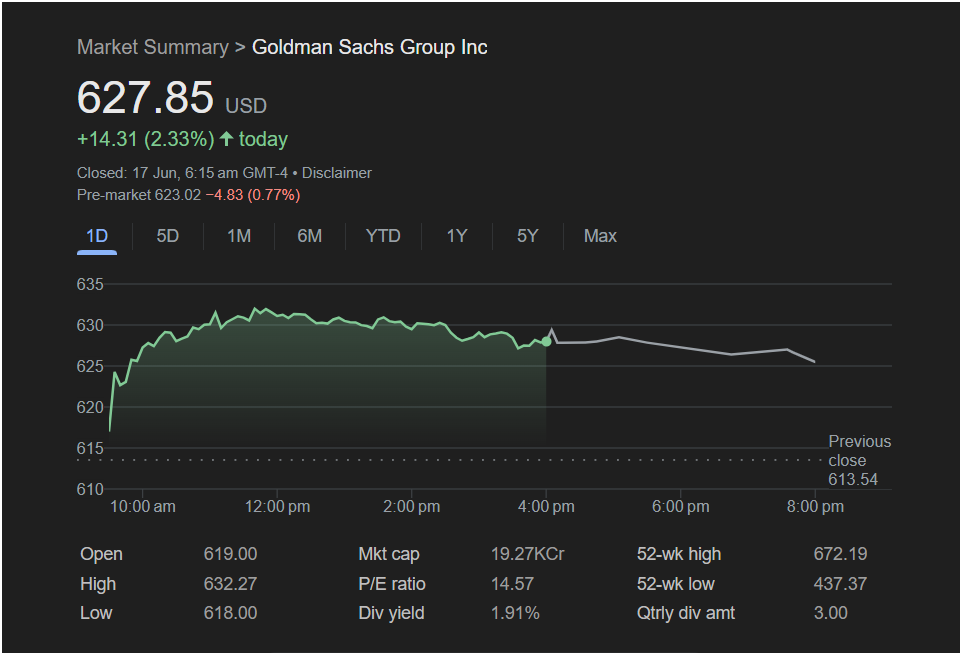
The investment banking giant’s stock finished the day at
14.31. This powerful move has put Goldman Sachs firmly on the watchlist, but the after-hours activity tells a more complex story. This analysis will break down the key data points to help traders navigate what’s next for this blue-chip stock.
A Closer Look at the Day’s Trading Action
Friday’s session for Goldman Sachs stock was a tale of early strength followed by afternoon consolidation.
-
The stock gapped up at the open, starting the day at $619.00, well above the previous close of $613.54.
-
An aggressive buying wave in the morning pushed the share price to a day’s high of $632.27.
-
Following this peak, the stock entered a consolidation phase, gradually pulling back but maintaining most of its gains and closing strong.
-
Crucially, pre-market data indicates a sell-off, with the price at
4.83 (0.77%) from the close.
Essential Data for Traders
Beyond the price action, these financial metrics provide a broader context for Goldman Sachs stock:
-
Open: $619.00
-
Day’s High/Low: $632.27 / $618.00
-
52-Week High/Low: $672.19 / $437.37
-
P/E Ratio: 14.57
-
Dividend Yield: 1.91%
-
Market Cap: 19.27KCr
-
Quarterly Dividend Amount: $3.00
With a P/E ratio of 14.57, Goldman Sachs appears reasonably valued compared to the broader market, which may attract value-focused investors. The 1.91% dividend yield also adds to its appeal for long-term holders.
Outlook for Monday: Will the Stock Go Up or Down?
The conflicting signals between the strong close and the weak pre-market make Monday’s open a critical moment for the stock.
The Bullish Scenario:
The impressive 2.33% gain shows strong institutional buying and positive sentiment. If the pre-market dip is merely short-term profit-taking and buying pressure resumes at the opening bell, Goldman Sachs stock could quickly challenge and break through its recent high of $632.27. A sustained move above this level would signal a continuation of the uptrend.
The Bearish Scenario:
The pre-market drop is the most significant warning sign. It suggests that sellers gained control after the market closed. If this selling pressure continues into Monday’s session, the stock could gap down and test key support levels. The first area of support would be the day’s opening price of
613.54.
Is it Right to Invest Today?
Given the mixed signals, a trader’s approach should depend on their risk appetite.
-
For Bullish Traders: The powerful uptrend might be seen as a primary indicator. They might consider the pre-market dip an opportunity to enter at a lower price, anticipating a bounce.
-
For Cautious Investors: The pre-market decline warrants patience. It would be wise to wait for the market to open on Monday to see if the price can stabilize above the
623 range. A confirmed break of resistance at 619.00 would be a clear bearish signal.
In conclusion, while Goldman Sachs stock showed formidable strength, the pre-market activity urges caution. Traders should closely watch the
619.00 support levels to determine the stock’s next move.

