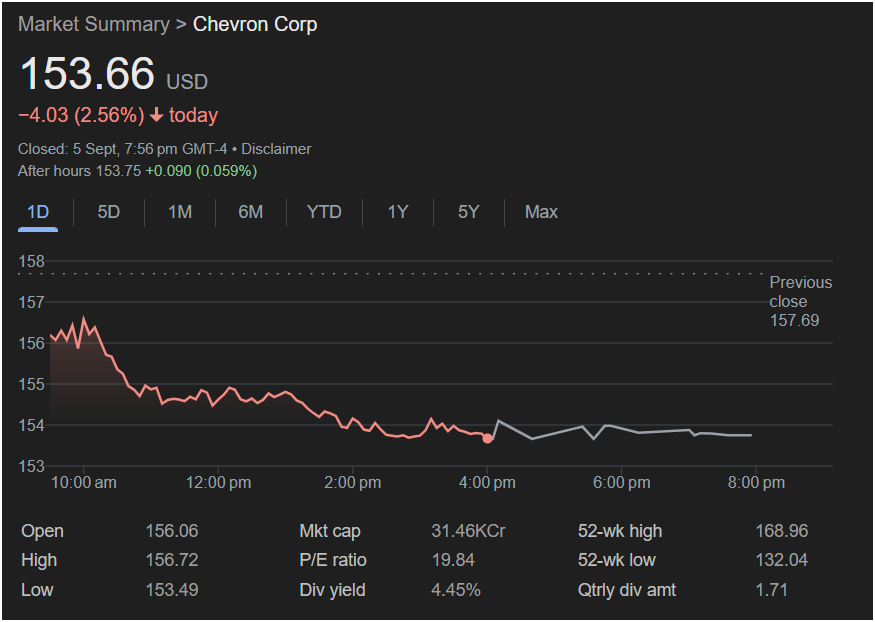
The image displays a “Market Summary” for Chevron Corp (CVX) as of September 5th. This snapshot provides several key data points, offering insights into the stock’s performance on that particular day, as well as some broader financial metrics.
Current Price and Daily Change:
-
Current Price: The stock closed at 153.66 USD.
-
Daily Change: On this specific day, Chevron’s stock experienced a decline of -4.03 USD, representing a -2.56% decrease. This indicates a challenging trading session for the company.
-
Time of Closure: The main data reflects the closing price at 7:56 pm GMT-4 on September 5th.
-
After-Hours Trading: Interestingly, there’s a small note about after-hours trading: 153.75 USD +0.090 (0.059%). This suggests a slight rebound or stabilization in the very short period after the official market close, though it’s a minimal change.
Intraday Performance (Graph):
The line graph visually represents the stock’s price movement throughout the trading day, from approximately 10:00 am to 8:00 pm.
-
Opening: The stock opened around 156 USD (specifically, 156.06 USD as noted in the “Open” metric below the graph).
-
Early Fluctuation: There was some initial volatility, with the stock briefly rising slightly above its open before beginning a more sustained downward trend.
-
Declining Trend: For most of the day, from late morning onwards, the stock consistently trended downwards, indicating selling pressure.
-
Stabilization (Later in the Day): Towards the late afternoon and evening, the decline appeared to slow, with the price stabilizing somewhat around the 153-154 USD range.
-
Previous Close: The graph also indicates the “Previous close” at 157.69 USD, providing a reference point against which the day’s performance can be measured. The day’s closing price is significantly below this previous close.
Key Financial Metrics (Below the Graph):
-
Open: 156.06 USD. This is the price at which the stock started trading at the beginning of the day.
-
High: 156.72 USD. This was the highest price Chevron stock reached during the trading day.
-
Low: 153.49 USD. This was the lowest price Chevron stock reached during the trading day.
-
Mkt cap (Market Capitalization): 31.46KCr. This likely stands for 31.46 Lakh Crores or 3.146 Trillion Indian Rupees, which is a very large market capitalization, indicating Chevron is a massive company. It’s important to note the “Cr” (Crore) unit, which is common in Indian financial reporting, suggesting the source of this summary might be from an Indian financial platform.
-
P/E ratio (Price-to-Earnings ratio): 19.84. This is a valuation multiple that compares the company’s current share price to its per-share earnings. A P/E of 19.84 suggests investors are willing to pay almost 20 times the company’s annual earnings for each share. This ratio can be compared to industry averages and historical P/E ratios for Chevron to determine if it’s considered overvalued, undervalued, or fairly valued.
-
Div yield (Dividend Yield): 4.45%. This represents the annual dividend income per share, expressed as a percentage of the stock’s current share price. A 4.45% dividend yield is relatively attractive, especially for income-focused investors, indicating Chevron returns a significant portion of its profits to shareholders.
-
52-wk high: 168.96. This is the highest price the stock has traded at over the past 52 weeks (one year).
-
52-wk low: 132.04. This is the lowest price the stock has traded at over the past 52 weeks.
-
Qtrly div amt (Quarterly Dividend Amount): 1.71. This is the cash dividend paid out to shareholders for each share they own, per quarter.
Implications and Further Considerations:
The daily decline of 2.56% on this particular day warrants further investigation. Potential reasons for such a drop could include:
-
Broader Market Trends: A general downturn in the stock market or specific sector (e.g., energy) could pull down Chevron’s stock.
-
Company-Specific News: Announcements related to Chevron’s earnings, production forecasts, legal issues, or strategic initiatives could impact its stock price.
-
Commodity Prices: As an oil and gas company, Chevron’s stock is highly sensitive to fluctuations in crude oil and natural gas prices. A drop in these commodity prices on September 5th could explain the stock’s decline.
-
Analyst Ratings: Changes in analyst recommendations or price targets can also influence investor sentiment.
-
Geopolitical Events: Global events impacting oil supply or demand can have a direct effect on energy companies.
Moving Forward:
To form a complete picture, this single day’s performance needs to be put into context. Investors would typically look at:
-
Longer-term trends: How has Chevron performed over the past week, month, year, or five years? The “1D”, “5D”, “1M”, “6M”, “YTD”, “1Y”, “5Y”, and “Max” tabs visible in the image indicate that these longer-term views are available.
-
Financial Health: A deeper dive into Chevron’s financial statements (income statement, balance sheet, cash flow statement) is crucial.
-
Industry Analysis: How does Chevron compare to its peers in the energy sector?
-
Future Outlook: What are the company’s growth prospects, capital expenditure plans, and dividend sustainability?
This snapshot provides a foundation, but a comprehensive understanding requires delving into these additional layers of analysis. The data indicates a volatile day for Chevron, but without further context, it’s difficult to draw definitive long-term conclusions.