Market Snapshot: A Look at Palantir Technologies Inc.’s Recent Performance
Understanding the Day's Trading for PLTR

The provided market summary offers a glance into the recent trading day for Palantir Technologies Inc. (PLTR), a prominent data analytics software company. As of the closing bell on September 5th, 7:59 pm GMT-4, the stock was valued at 153.11 USD. This figure represents a daily decline of 3.03 USD, or 1.94%, indicating a challenging trading session for the company. The after-hours trading activity also shows a slight further dip, with the stock at 152.30 USD, down an additional 0.81 USD (0.53%) from its closing price.
Intraday Price Movements: A Rollercoaster Ride
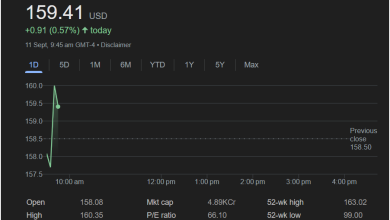
Examining the 1-day chart provides a granular view of PLTR’s price fluctuations throughout the trading day. The stock opened at 157.82 USD, suggesting a relatively stable start. However, the initial hours of trading saw a significant downward trend, with the price plummeting to a daily low of 148.04 USD. This early morning sell-off could be attributed to various factors, including broader market sentiment, company-specific news, or investor reactions to prior-day events.
Following this sharp decline, the stock experienced a notable recovery, beginning to climb steadily from around 10:00 AM until just past 2:00 PM. This upward momentum brought the price back above the 152 USD mark, showcasing a resilient rebound from its intraday low. The daily high reached 158.97 USD at some point, although the chart indicates the peak of the recovery was closer to the 154-155 USD range before settling.
From the afternoon onwards, specifically after 2:00 PM, the price largely stabilized. While there were minor fluctuations, the stock traded within a relatively narrow band, hovering around the 152-153 USD range for the remainder of the trading day. This suggests that after the initial volatility, the market found a temporary equilibrium for PLTR, with buying and selling pressures evening out. The previous close was 156.14 USD, which further contextualizes the day’s closing price as a significant drop from the prior session.
Key Financial Metrics and Their Implications
Beyond the immediate price action, the market summary provides several other important metrics that offer deeper insights into Palantir’s current valuation and market standing:
-
Market Capitalization (Mkt cap): 36.31KCr
-
This figure, likely in crores (a unit used in some financial markets, equivalent to 10 million), indicates the total market value of all outstanding shares of Palantir. A high market cap suggests a large, established company, but without the precise currency unit (e.g., USD, INR), it’s hard to make direct comparisons to other global companies. Assuming “Cr” refers to crores of USD, 36.31K Cr would be an exceptionally large market cap, likely indicating a different interpretation of the unit or a typo in the provided image. If it’s 36.31 billion USD, that’s a substantial valuation for a technology company.
-
-
P/E Ratio: 508.81
-
The Price-to-Earnings (P/E) ratio is a crucial valuation metric, comparing a company’s current share price to its per-share earnings. A P/E of 508.81 is extraordinarily high. This typically suggests that investors are willing to pay a significant premium for PLTR shares, often driven by expectations of very high future growth. Such a high P/E ratio can indicate that the stock is considered “growth stock” and is trading at a premium, or it could suggest that current earnings are low relative to the stock price. It also implies that the company might not be highly profitable yet, or its profits are not keeping pace with its market valuation, making it a potentially risky investment for those seeking value.
-
-
Div yield: –
-
The hyphen indicates that Palantir Technologies does not currently pay a dividend to its shareholders. This is common for growth-oriented technology companies that often reinvest all their earnings back into the business for further expansion rather than distributing profits to shareholders.
-
-
Qtrly div amt: –
-
Correspondingly, there is no quarterly dividend amount.
-
52-Week Performance: Highs and Lows
The summary also provides context on Palantir’s performance over a longer timeframe:
-
52-week high: 189.46
-
This is the highest price the stock has traded at over the past year. Comparing the current price of 153.11 USD to the 52-week high of 189.46 USD shows that PLTR is currently trading significantly below its annual peak. This could suggest either a correction from an overvalued position or a period of decreased investor confidence.
-
-
52-week low: 29.50
-
This is the lowest price the stock has traded at over the past year. The current price is substantially higher than the 52-week low, indicating a significant upward movement from its weakest point within the last year. This range highlights the considerable volatility Palantir’s stock has experienced.
-
Navigating the Timeframes: 1D to Max
The interactive tabs for “1D,” “5D,” “1M,” “6M,” “YTD,” “1Y,” “5Y,” and “Max” indicate the ability to view the stock’s performance across different time horizons. While only the “1D” chart is visible, the presence of these options is crucial for investors who want to understand the short-term noise versus the long-term trends of the stock. A single day’s performance, as shown, can be highly volatile and is often not indicative of a company’s fundamental health or long-term trajectory. Looking at “Max” data would reveal the stock’s performance since its inception or IPO, providing the broadest possible historical context.
Potential Considerations and Further Analysis
The snapshot provides valuable data points, but a comprehensive understanding of Palantir Technologies Inc. would necessitate further investigation into:
-
Company-Specific News: Recent announcements, earnings reports, contract wins or losses, and product developments can significantly influence stock prices.
-
Industry Trends: The broader software and data analytics industry landscape, including competitive pressures and technological advancements, plays a vital role.
-
Economic Conditions: Macroeconomic factors like interest rates, inflation, and overall market sentiment can impact investor appetite for growth stocks like PLTR.
-
Analyst Ratings and Price Targets: Opinions from financial analysts can offer different perspectives on the company’s future prospects.
-
Volume: The trading volume associated with these price movements is also a critical indicator. High volume during a price decline, for instance, can signify strong selling pressure.
the image offers a clear and concise summary of Palantir Technologies Inc.’s recent trading day, revealing a downward trend and highlighting key financial metrics that warrant deeper analysis for anyone considering an investment in the company.