Broadcom Inc. (AVGO) Stock Performance Analysis
A Snapshot of September 5th Trading and Key Financial Metrics
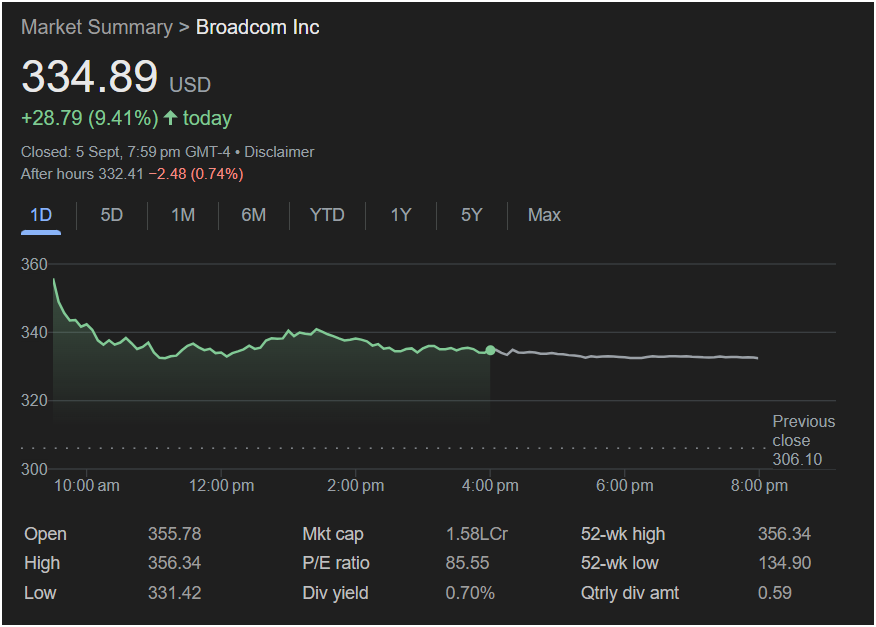
The provided image offers a market summary for Broadcom Inc. (AVGO), a prominent global technology company. The data specifically highlights its performance on September 5th, with a focus on daily price movements and several key financial indicators. This analysis will delve into the various components presented in the summary, offering insights into the stock’s recent activity and valuation.
Daily Stock Performance Overview:
On September 5th, Broadcom Inc. closed at 334.89 USD, marking a significant increase of +28.79 USD or 9.41% for the day. This indicates a very positive trading session for the company’s stock.
-
Closed Price: The stock closed at 334.89 USD.
-
Daily Change: It gained 28.79 USD, representing a 9.41% increase.
-
Trading Date and Time: The market closed on September 5th, at 7:59 pm GMT-4.
-
After-hours Trading: After the official market close, the stock saw a slight decrease of 2.48 USD, or 0.74%, trading at 332.41 USD. This suggests some profit-taking or minor adjustments by investors after the main trading hours.
Intraday Price Movement (The Graph):
The graph visually represents the stock’s price fluctuations throughout the trading day.
-
Opening Price: The stock opened at 355.78 USD. It appears to have opened higher than its previous close, indicating strong positive sentiment at the start of the day.
-
Early Decline: From the opening at 355.78 USD around 10:00 am, the price experienced a noticeable dip, reaching its low point of 331.42 USD around 10:00 am to 11:00 am.
-
Recovery and Stabilization: After hitting its daily low, the stock price recovered and then traded within a relatively stable range for the remainder of the day, generally hovering between 335 USD and 340 USD.
-
Closing Value: The graph confirms the closing price of 334.89 USD, which is shown as the last point on the solid green line before the dashed grey line representing after-hours trading.
-
Previous Close: The previous day’s closing price was 306.10 USD, which explains the substantial gain on September 5th.
Key Financial Metrics:
The table at the bottom right provides several important financial ratios and figures that offer deeper insights into Broadcom Inc.’s valuation and performance.
-
Open: 355.78: As mentioned, this was the stock’s price at the start of the trading day.
-
High: 356.34: This is the highest price the stock reached during the trading day, shortly after opening.
-
Low: 331.42: This is the lowest price the stock touched during the trading day, occurring in the earlier part of the session.
-
Mkt Cap (Market Capitalization): 1.58L Cr: Market capitalization is the total value of all outstanding shares of a company. “1.58L Cr” likely refers to 1.58 Lakh Crore, which would be an extremely large number, probably 1.58 Trillion (1,580,000,000,000) USD, considering “Lakh Crore” is an Indian numbering system term. This figure indicates Broadcom is a very large-cap company.
-
P/E Ratio (Price-to-Earnings Ratio): 85.55: The P/E ratio is a valuation metric that compares a company’s current share price to its earnings per share. A P/E of 85.55 is relatively high, suggesting that investors are willing to pay a premium for Broadcom’s earnings, possibly due to expectations of future growth or its strong market position.
-
Div Yield (Dividend Yield): 0.70%: Dividend yield is the annual dividend per share divided by the share price. A 0.70% yield indicates that Broadcom pays a relatively modest dividend compared to its stock price. For income-focused investors, this might be less attractive, but growth-oriented investors often prioritize capital appreciation over high dividends.
-
52-wk high: 356.34: This is the highest price the stock has traded at over the past 52 weeks. Interestingly, the daily high on September 5th matches the 52-week high, indicating that the stock hit a new annual peak during this trading session.
-
52-wk low: 134.90: This is the lowest price the stock has traded at over the past 52 weeks. Comparing this to the current price shows a substantial recovery and growth over the past year.
-
Qtrly div amt (Quarterly Dividend Amount): 0.59: This is the amount of dividend paid per share on a quarterly basis.
The data from September 5th paints a picture of strong positive momentum for Broadcom Inc., with a significant daily gain and the stock reaching its 52-week high. This performance, coupled with a high P/E ratio, suggests investor confidence in the company’s future prospects. The large market capitalization solidifies its position as a major player in the technology sector. The dividend yield, while not exceptionally high, indicates a stable company returning some value to its shareholders. Further analysis would involve examining sector trends, company-specific news, earnings reports, and comparing these metrics to industry peers to form a more comprehensive understanding of Broadcom’s investment profile.