Analyzing Walmart Inc.’s Stock Performance: A Day in the Life of a Market Giant
A Deep Dive into the Intraday Fluctuations and Key Metrics of a Retail Powerhouse

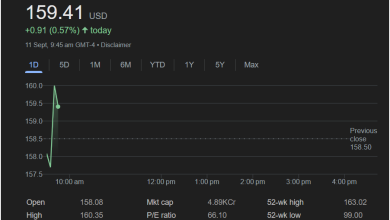
The provided image offers a snapshot of Walmart Inc.’s stock performance on a single trading day, specifically September 5th, with data extending slightly into after-hours trading. At first glance, the stock closed at 100.51 USD, representing a modest decline of 0.42 USD, or 0.42%, from its previous close of 100.93 USD. This percentage change, while seemingly small, can translate into significant shifts in market capitalization for a company of Walmart’s immense scale. The market summary indicates that this data was closed on September 5th at 7:57 PM GMT-4, with after-hours trading showing a further slight dip to 100.42 USD.
Intraday Price Action: A Rollercoaster of Activity
The 1-day chart visually depicts the stock’s journey throughout the trading day, presenting a fascinating narrative of investor sentiment and market dynamics. The day began with an opening price of 101.08 USD, suggesting a slight upward momentum from the previous close. However, almost immediately, the stock experienced a notable decline in the morning hours, dipping below the 100 USD mark. This early-day downturn could be attributed to a variety of factors, including broader market trends, specific news related to the retail sector, or even profit-taking by investors who saw the initial opening price as an opportunity to sell.
As the day progressed, around the 12:00 PM to 2:00 PM mark, the stock stabilized somewhat, trading within a tighter range before exhibiting a noticeable recovery. This upward trend continued into the late afternoon, with the stock briefly surpassing the 100.50 USD level around 4:00 PM. This mid-to-late afternoon rally could be indicative of positive news emerging, renewed investor confidence, or simply a shift in trading patterns as market participants adjusted their positions. The peak for the day, as indicated in the “High” metric, was 101.48 USD, occurring earlier in the day, while the “Low” hit 99.55 USD.
The chart then shows the stock hovering around the 100.50 USD mark as regular trading hours concluded. The transition into after-hours trading reveals a relatively flat trajectory, with a marginal decline from the closing price. After-hours trading often sees lower volumes and can be influenced by earnings reports, breaking news, or analysts’ upgrades/downgrades that are released outside of regular market hours.
Key Financial Metrics: Unpacking the Fundamentals
Beyond the immediate price fluctuations, the provided summary also offers crucial fundamental metrics that provide a broader context for Walmart’s financial health and valuation.
-
Market Cap (Mkt cap): 80.14KCr This figure, representing 80.14 trillion (assuming “KCr” means “Thousand Crores” or 10^13, which would be an incredibly large market cap if interpreted as “KCr” meaning “kilo crore” i.e., 1000 * 10^7 = 10^10, then 80.14 * 10^10 which is still very large, or perhaps it signifies a different regional currency notation for trillions or billions). Given the standard notation for market capitalization in USD, if “KCr” were to represent “Thousand Crores” in the Indian numbering system, 1 Crore is 10 million. So 80.14 KCr would be 80.14 * 1000 * 10,000,000 = 8.014 x 10^14, which is an exceptionally large number. More commonly, for a US company like Walmart, market capitalization is expressed in billions or trillions of USD. If we assume a typical market capitalization for Walmart, which often hovers around 400-500 billion USD, there might be a misinterpretation of the “KCr” notation or a specific regional context to this figure that is not immediately clear. For instance, if “Cr” refers to “crore” in the Indian number system, and “KCr” means “thousand crores,” this would imply an extremely high value. In standard Western financial notation, Walmart’s market cap is typically in the hundreds of billions of dollars. This discrepancy highlights the importance of understanding the specific units and conventions used in financial data presentation. If we were to assume “KCr” is a placeholder or a misprint and consider general knowledge of Walmart’s market cap, it would be a figure in the hundreds of billions of dollars, making it one of the largest companies globally. This massive market capitalization underscores Walmart’s dominant position in the retail sector and its significant influence on various economic indicators.
-
P/E Ratio: 37.92 The Price-to-Earnings (P/E) ratio is a widely used valuation multiple that compares a company’s current share price to its earnings per share (EPS). A P/E ratio of 37.92 suggests that investors are willing to pay nearly 38 times Walmart’s annual earnings for each share. This figure is relatively high compared to the broader market average or some of its retail peers, which might indicate that investors have high expectations for Walmart’s future earnings growth. Alternatively, it could reflect the company’s stability, its strong brand recognition, or its perceived resilience in various economic conditions, making it a “safe haven” investment for some.
-
Div yield: 0.94% The dividend yield represents the annual dividend payment per share as a percentage of the current share price. A dividend yield of 0.94% indicates that for every 100 USD invested in Walmart stock, an investor would receive approximately 0.94 USD in annual dividends. While not a high-yield stock, Walmart is known for its consistent dividend payments, making it attractive to income-focused investors who prioritize steady returns in addition to potential capital appreciation. The consistency of its dividends reflects its mature business model and strong cash flow generation.
-
Qtrly div amt: 0.24 This refers to the quarterly dividend amount per share, which is 0.24 USD. Multiplying this by four quarters would give an annual dividend of 0.96 USD (0.24 * 4), which aligns closely with the dividend yield calculation when considering the stock price. This consistent quarterly payout demonstrates Walmart’s commitment to returning value to its shareholders.
52-Week Performance: A Wider Lens
The 52-week high and low figures provide a broader perspective on the stock’s performance over the past year, highlighting its volatility and the range within which it has traded.
-
52-wk high: 105.30 This indicates the highest price Walmart’s stock reached in the last 52 weeks. The current price of 100.51 USD is relatively close to this high, suggesting that the stock has performed well over the past year and is trading near its peak valuation within that period.
-
52-wk low: 76.30 This represents the lowest price the stock traded at in the past 52 weeks. The significant difference between the 52-week high and low (a spread of approximately 29 USD) illustrates the stock’s price fluctuations and the potential for both gains and losses for investors over a yearly cycle. Understanding this range is crucial for investors assessing risk and potential entry or exit points.
Beyond the Numbers: Factors Influencing Walmart’s Stock
While the image provides a wealth of numerical data, it’s essential to consider the qualitative factors that influence Walmart’s stock performance. As a global retail giant, Walmart is subject to a multitude of economic, social, and competitive pressures.
-
Consumer Spending Habits: Walmart’s performance is intrinsically linked to consumer spending. Economic indicators such as inflation, employment rates, and disposable income directly impact how much consumers are willing and able to spend on goods, which in turn affects Walmart’s sales and profitability.
-
E-commerce Competition: The rise of e-commerce, particularly the dominance of Amazon, poses a significant competitive challenge to traditional brick-and-mortar retailers like Walmart. Walmart has invested heavily in its own e-commerce capabilities, including online grocery pickup and delivery, to compete effectively in the digital landscape.
-
Supply Chain Resilience: The global supply chain has faced unprecedented disruptions in recent years. Walmart’s ability to manage its vast supply chain efficiently, ensure product availability, and control costs is critical to its operational success and, consequently, its stock performance.
-
Inflationary Pressures: Rising inflation impacts both Walmart’s cost of goods sold and consumer purchasing power. The company’s ability to manage pricing strategies, negotiate with suppliers, and maintain its “everyday low prices” reputation in an inflationary environment is closely watched by investors.
-
Labor Costs and Workforce Management: As one of the largest private employers globally, Walmart’s labor costs, including wages, benefits, and workforce management strategies, have a direct impact on its operating expenses and profitability.
-
Technological Advancements: Walmart continuously invests in technology, from in-store automation to data analytics, to improve efficiency, enhance the customer experience, and gain a competitive edge. These investments, while costly in the short term, can drive long-term growth and profitability.
-
Global Economic Conditions: With a significant international presence, Walmart’s performance is also influenced by economic conditions in various countries where it operates. Currency fluctuations, geopolitical events, and local consumer trends all play a role.
-
ESG (Environmental, Social, Governance) Factors: Increasingly, investors are considering ESG factors when making investment decisions. Walmart’s initiatives in sustainability, ethical sourcing, and community engagement can influence its brand reputation and investor appeal.
The Role of Investor Sentiment and Market Psychology
The intraday chart, with its peaks and valleys, clearly illustrates the ebb and flow of investor sentiment. Moments of sharp decline might be driven by negative news headlines, broader market sell-offs, or even algorithmic trading patterns. Conversely, periods of recovery could be fueled by positive analyst reports, a general rebound in the market, or increased buying activity as investors perceive the stock to be undervalued after a dip.
The “Previous close” and “Open” prices are crucial indicators of how the market is reacting to information that may have emerged overnight. A gap up (opening higher than the previous close) suggests positive sentiment, while a gap down indicates negative sentiment. In this instance, the stock opened slightly higher than the previous close, but this initial enthusiasm quickly dissipated.
The volume of trading, while not explicitly shown in this summary, is another critical factor. High volume during price movements can signify conviction behind those moves, while low volume might suggest less significant shifts.
Looking Ahead: The Unwritten Narrative
The provided image is a single chapter in Walmart’s ongoing financial story. To draw comprehensive conclusions, one would need to analyze longer-term trends (as suggested by the 1D, 5D, 1M, 6M, YTD, 1Y, 5Y, Max options on the chart), delve into financial statements, and consider macroeconomic forecasts.
For instance, understanding the broader market context on September 5th would be vital. Was the S&P 500 up or down? Were other retail stocks experiencing similar movements? Such comparative analysis can help determine whether Walmart’s performance was company-specific or part of a larger market trend.
Furthermore, analyzing the news and announcements related to Walmart on or around that specific day would provide crucial context. Did the company release any strategic updates, earnings guidance, or product announcements? Were there any significant analyst upgrades or downgrades? These events can significantly sway investor opinion and, consequently, stock prices.
The journey of Walmart’s stock price reflects a complex interplay of internal company performance, external market forces, and the collective psychology of investors. This single-day snapshot serves as a testament to the dynamic nature of financial markets, where even a global behemoth like Walmart experiences constant fluctuations influenced by a myriad of seen and unseen factors. The absence of a definitive conclusion in this analysis mirrors the continuous, evolving narrative of a publically traded company, where every day presents new data points for interpretation and future predictions. The provided data opens up more questions than answers, inviting deeper investigation into the underlying causes of the observed movements and the long-term implications for Walmart Inc.
If you’d like to explore any specific aspect of this data further, or if you have other questions, please feel free to ask!