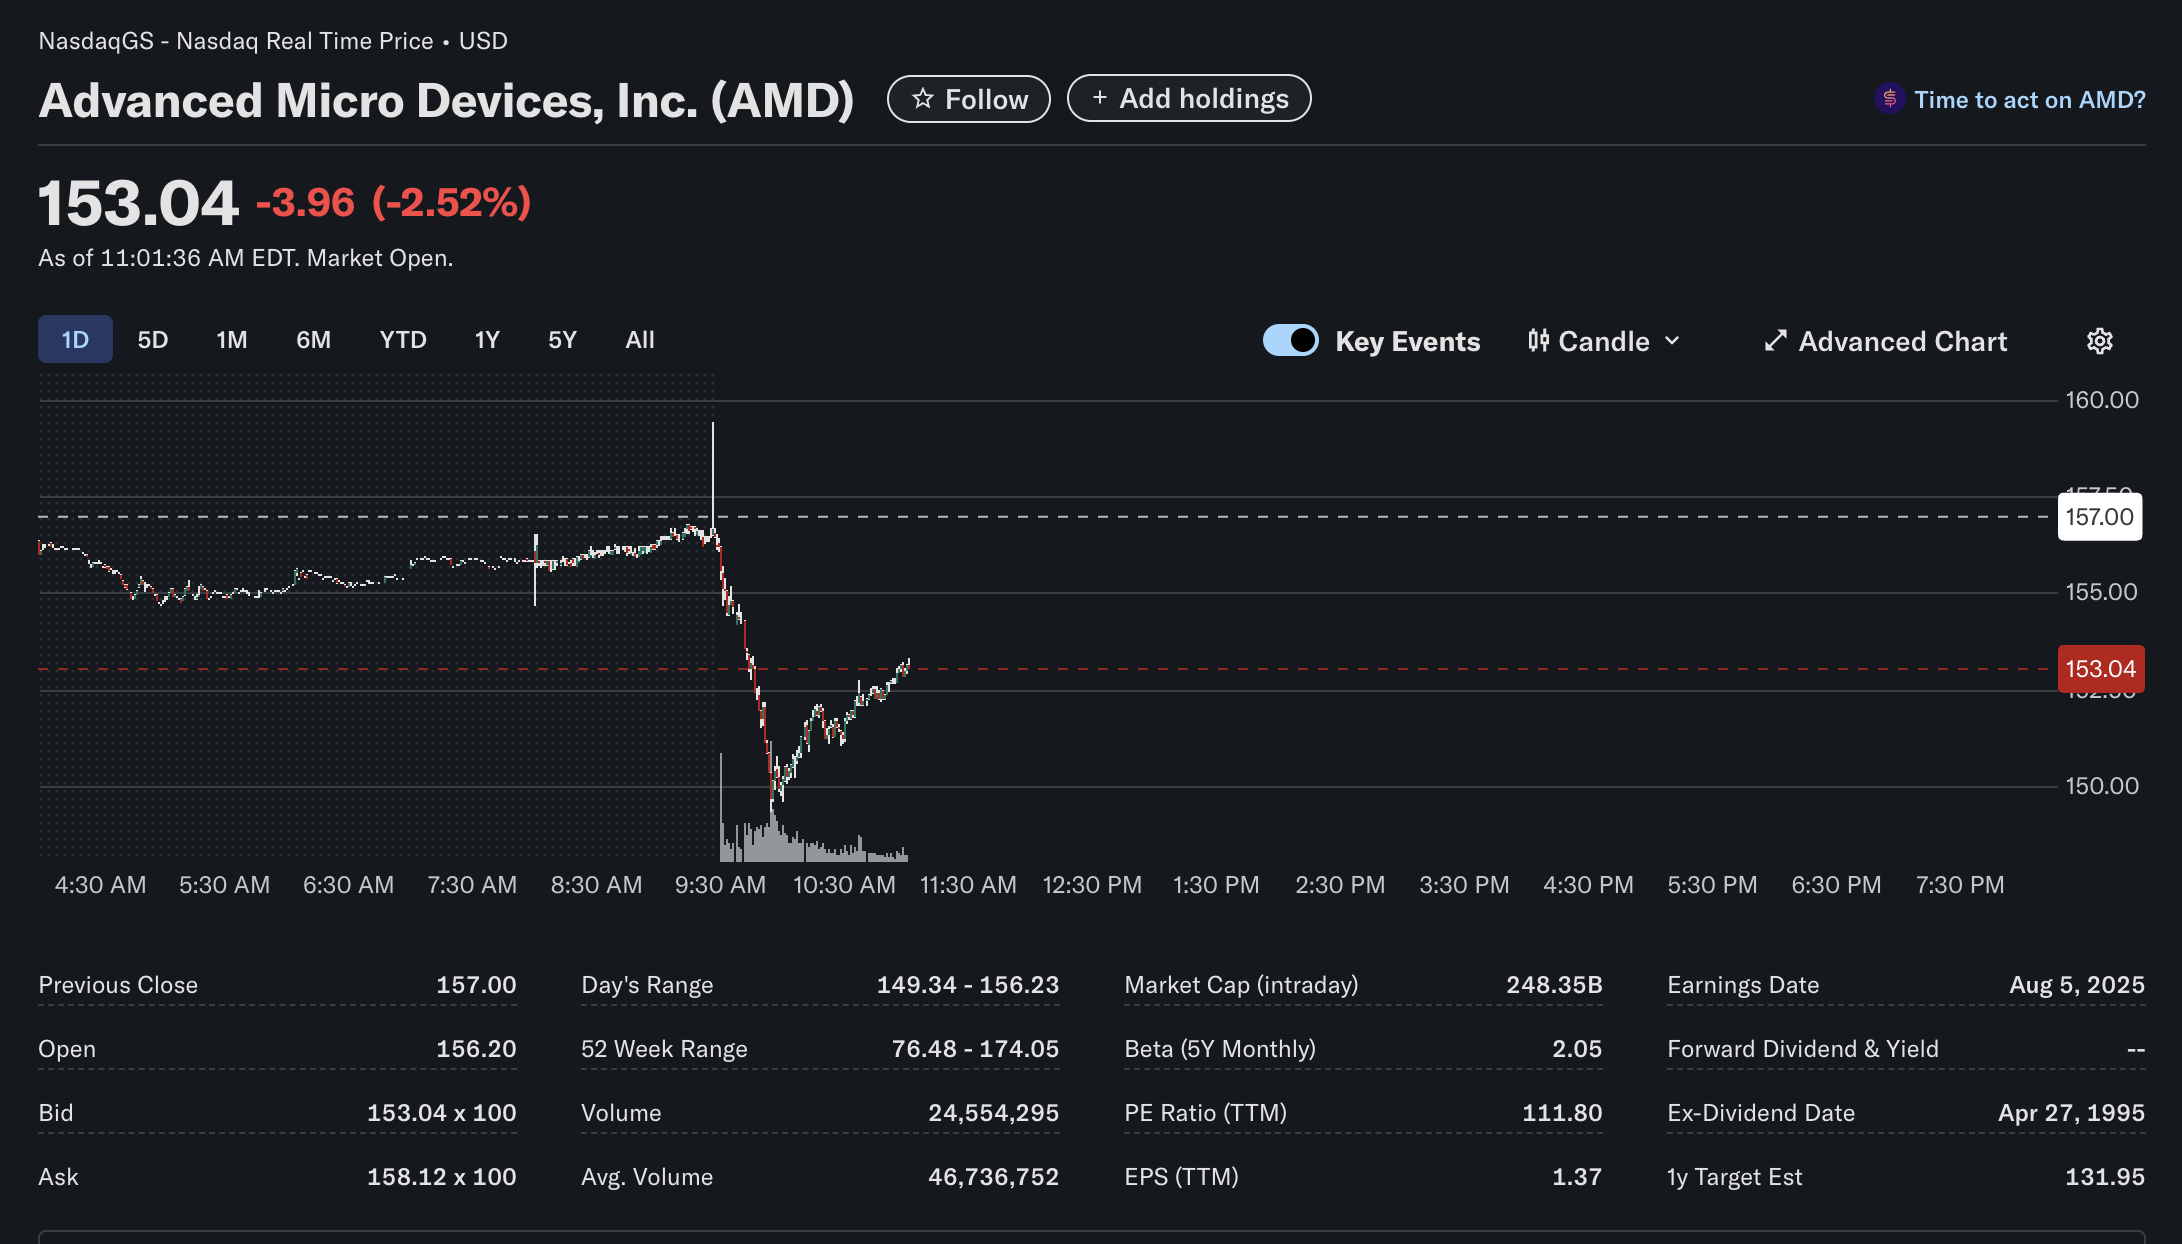
Shares of Advanced Micro Devices, Inc. (Nasdaq: AMD) are trading significantly lower in a volatile session, marked by a sharp decline at the market open. As of 11:01 AM EDT, the stock was trading at $153.04, a decrease of $3.96 or 2.52% for the day.
The semiconductor giant is experiencing heavy selling pressure, pushing it well below its previous closing price. This article provides a comprehensive overview of the stock’s performance based on the technical, fundamental, and sentiment indicators available from the real-time data.
Technical Analysis: A Sharp Drop and an Attempted Rebound
The intraday chart for AMD reveals a dramatic start to the trading day.
-
Bearish Open: After trading relatively stable in pre-market hours, AMD experienced a significant gap down at the 9:30 AM market open. The stock fell sharply from its opening price of $156.20, quickly breaking below the $150 mark.
-
Key Support and Resistance: The stock established an intraday low of $149.34, which is now acting as a critical support level. Following this low, the price has started to rebound, suggesting some buyers are stepping in at these lower levels. The opening price near $156.20 and the previous close of $157.00 now serve as potential resistance levels.
-
Volume: Trading volume stood at 24.5 million shares just over an hour and a half into the session. While this is below the average volume of 46.7 million, it indicates a significant amount of activity, especially surrounding the initial price drop.
Fundamental Analysis: A Look at Valuation and Projections
The fundamental data for AMD presents the profile of a major, high-growth technology company.
-
Market Position: With a substantial market capitalization of $248.35 billion, AMD is a leading force in the global semiconductor industry.
-
Valuation: The stock’s Price-to-Earnings (P/E) ratio is high at 111.80. This indicates that investors have priced in significant future earnings growth and are willing to pay a premium for the shares. The company is profitable, with a trailing twelve-month (TTM) Earnings Per Share (EPS) of $1.37.
-
Volatility: AMD’s beta of 2.05 suggests that the stock is historically twice as volatile as the broader market, a characteristic on display during today’s session.
-
Analyst Outlook: A notable data point is the 1-year analyst target estimate of $131.95. This average target is considerably lower than the current trading price of $153.04, implying that, on average, Wall Street analysts see potential downside risk over the next year.
-
Dividends: AMD does not currently pay a dividend, as is common for many growth-focused technology companies that prefer to reinvest earnings back into the business.
Sentiment Analysis: Bearish Pressure Meets Dip-Buying Interest
The market sentiment surrounding AMD appears to be predominantly negative in the short term, though with some nuances.
-
Short-Term Sentiment: The sharp gap down at the open is a clear sign of bearish sentiment, likely driven by broader market concerns or sector-specific news. However, the bounce from the day’s low of $149.34 shows that there is buying interest, suggesting some investors view the drop as an opportunity. The overall sentiment for the day remains bearish.
-
Long-Term Sentiment: The fundamental data paints a mixed picture. The high P/E ratio reflects strong long-term investor optimism in AMD’s strategic position, particularly in areas like artificial intelligence. Conversely, the lower 1-year analyst price target suggests a more cautious or bearish stance from the professional analyst community regarding the stock’s current valuation.
In conclusion, AMD is navigating a challenging trading session characterized by a significant initial sell-off followed by a modest recovery attempt. While the company’s long-term growth story remains a key focus for investors, its high valuation and a more conservative analyst outlook are critical factors to consider.
Disclaimer: This article is for informational purposes only and is based on real-time data from the provided image as of 11:01 AM EDT. It should not be considered financial or investment advice. Investors should conduct their own research and consult with a financial professional before making any investment decisions.