A Snapshot of Meta Platforms Inc. Stock Performance: An Intraday and Broader Contextual Review
Exploring the Nuances of Market Activity and Key Financial Indicators for META
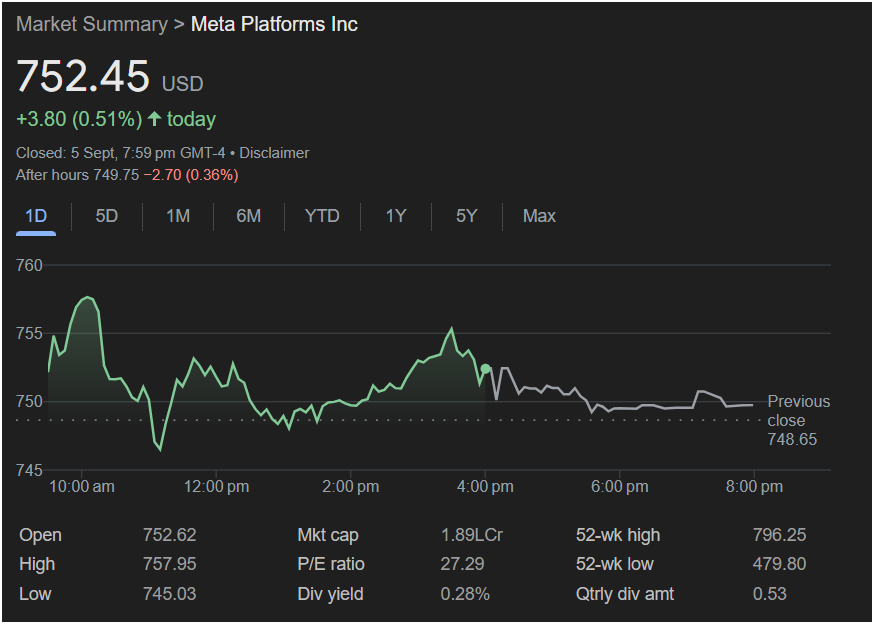
The provided image presents a “Market Summary” for Meta Platforms Inc. (META), displaying its stock performance as of “Closed: 5 Sept, 7:59 pm GMT-4.” The primary focus of the chart is the intraday performance for the “1D” (1 Day) period, but it also offers crucial summary statistics and navigation options for broader timeframes.
I. Intraday Performance (1 Day View): Dynamic Price Fluctuations
The central graph vividly illustrates the price movement of META stock throughout the trading day on September 5th.
-
Opening and Closing: The day opened at 752.62 USD and closed at 752.45 USD. This indicates a relatively stable open and close, with the closing price being slightly lower than the opening price, though the “today” change shows a positive gain due to the comparison with the previous day’s close (748.65 USD). The “after hours” trading, however, shows a slight dip to 749.75 USD, down 2.70 (0.36%). This highlights that market activity continues beyond regular trading hours, often reacting to late-breaking news or investor sentiment.
-
Intraday Volatility: The green line charting the stock price reveals noticeable fluctuations throughout the day.
-
Early Morning Surge: Around 10:00 AM, the stock shows an upward trend, peaking at the day’s high of 757.95 USD before 11:00 AM. This initial surge could be attributed to positive market sentiment at the open, news releases, or specific trading activities.
-
Mid-Day Retreat and Consolidation: Following the morning peak, the price experiences a decline, reaching its intraday low of 745.03 USD around 12:00 PM. This is a significant drop from the high, indicating profit-taking or a shift in investor sentiment. The price then appears to consolidate, hovering mostly between 748 USD and 752 USD for much of the afternoon, showing periods of mild recovery and subsequent pullbacks.
-
Afternoon Recovery and Close: Towards the latter part of the afternoon, particularly after 2:00 PM, there’s another noticeable upward movement, pushing the stock back above 750 USD, before a slight dip and a relatively flat close around the 752.45 USD mark.
-
-
Volume Implication (Implicit): While the chart doesn’t explicitly display trading volume, the significant price movements suggest periods of higher trading activity. Sharp rises or falls often correlate with increased buying or selling pressure, respectively. A high-volume surge could indicate strong conviction, while a low-volume fluctuation might be less significant.
-
Relative Strength/Weakness: Comparing the intraday performance to the previous close of 748.65 USD, the stock spent significant portions of the day trading both above and below this level. This indicates a mixed sentiment among investors within the day, ultimately ending slightly higher than the previous close.
II. Key Summary Statistics: A Glimpse into Valuation and Performance Metrics
Below the chart, several critical financial metrics provide a broader context for Meta Platforms Inc.’s stock.
-
Current Price and Daily Change: The most prominent information is the current trading price of 752.45 USD, which is +3.80 (0.51%) higher than the previous day’s close. This positive change on the day suggests a modest gain for investors holding the stock from the prior trading session.
-
Open, High, Low: These figures (Open: 752.62, High: 757.95, Low: 745.03) delineate the boundaries of the day’s trading range, offering insights into the volatility and price discovery process. A wide range between high and low often signifies high interest and potential for significant price swings.
-
Market Capitalization (Mkt Cap): 1.89L Cr
-
“1.89L Cr” translates to 1.89 Lakh Crores, which in the Western system is approximately 1.89 trillion (1.89 x 10^12) USD. This figure represents the total market value of all outstanding shares of Meta Platforms Inc. A market cap of this magnitude firmly establishes Meta as one of the largest publicly traded companies globally, indicating its significant influence on major indices and the broader economy. Companies with such large market caps are often considered “blue-chip” stocks, though they can still experience volatility.
-
-
P/E Ratio (Price-to-Earnings Ratio): 27.29
-
The P/E ratio is a widely used valuation metric that compares a company’s current share price to its per-share earnings. A P/E of 27.29 suggests that investors are willing to pay 27.29 times the company’s annual earnings per share for Meta stock. This ratio can be interpreted in various ways:
-
Growth Expectations: A higher P/E often indicates that investors expect strong future earnings growth. Companies in high-growth sectors, like technology, frequently have higher P/E ratios than mature companies in slower-growth industries.
-
Industry Comparison: To truly assess if 27.29 is “high” or “low,” it would need to be compared to the P/E ratios of its peers in the technology and social media sectors, as well as the broader market average (e.g., S&P 500 P/E).
-
Historical Context: Analyzing Meta’s historical P/E ratio would also provide context on how its current valuation compares to its past.
-
-
-
Div Yield (Dividend Yield): 0.28%
-
The dividend yield represents the annual dividend payment as a percentage of the stock’s current share price. A yield of 0.28% is relatively low.
-
Growth vs. Income: This low dividend yield is typical for technology companies like Meta, which traditionally reinvest most of their earnings back into the business for research and development, acquisitions, and expansion, rather than distributing them to shareholders as dividends. Investors in Meta are likely more focused on capital appreciation (stock price growth) rather than dividend income.
-
Recent Introduction: Meta only recently initiated a dividend in February 2024, so this is a relatively new aspect of its financial strategy. The modest yield reflects its initial phase as a dividend-paying company.
-
-
-
Qtrly Div Amt (Quarterly Dividend Amount): 0.53
-
This indicates that Meta pays a quarterly dividend of 0.53 USD per share. This figure, combined with the stock price, helps calculate the annual dividend and the dividend yield.
-
-
52-week High: 796.25
-
This is the highest price the stock has traded at over the past 52 weeks (one year). The current price of 752.45 USD is below this high, suggesting that the stock has experienced higher valuations within the last year and is currently trading at a discount to its annual peak.
-
-
52-week Low: 479.80
-
This is the lowest price the stock has traded at over the past 52 weeks. The current price is significantly above this low, indicating a substantial recovery or growth from its lowest point in the last year. The wide range between the 52-week high and low (approximately 316.45 USD) highlights the considerable volatility and price movement Meta has experienced.
-
III. Navigation Options: Exploring Broader Timeframes
The tabs “1D,” “5D,” “1M,” “6M,” “1Y,” “5Y,” and “Max” indicate the availability of historical data for various timeframes. This is crucial for a more comprehensive analysis:
-
Short-Term (5D, 1M): These views would reveal recent trends, momentum, and short-term resistance or support levels.
-
Medium-Term (6M, 1Y): These would show the stock’s performance over several months to a year, helping identify broader trends, such as bull or bear markets for the stock, and the impact of significant company news or economic events. The 52-week high and low are directly relevant to the 1Y view.
-
Long-Term (5Y, Max): These provide a macro perspective on Meta’s growth trajectory since its IPO. Long-term charts are essential for understanding the company’s fundamental growth, its resilience during market downturns, and its overall lifecycle as a public company. For a company like Meta, a “Max” chart would illustrate its journey from a relatively young social media company to a dominant global technology conglomerate.
IV. Interpretation and Unanswered Questions (Open-Ended Nature)
As requested, this analysis remains open-ended, without drawing definitive conclusions or making predictions. However, the data presented naturally leads to further questions and areas for deeper investigation:
-
Drivers of Intraday Movement: What specific news, analyst reports, or broader market movements influenced the peaks and troughs on September 5th? Was there any sector-specific news affecting technology stocks?
-
Valuation Comparison: How does Meta’s P/E ratio of 27.29 compare to its direct competitors (e.g., Google, Amazon, other social media platforms) and the broader market average? Is it overvalued, undervalued, or fairly valued relative to its growth prospects?
-
Dividend Sustainability: Given the recent introduction of dividends, what is the company’s dividend policy, and how sustainable is the 0.53 USD quarterly payout in the long term? What impact might this have on its capital allocation strategy?
-
Future Growth Catalysts: What are Meta’s key growth initiatives (e.g., Metaverse investments, AI development, advertising innovations) that might drive future earnings and stock price appreciation?
-
Risk Factors: What are the primary risks facing Meta (e.g., regulatory scrutiny, competition, advertising market fluctuations, data privacy concerns) that could impact its future performance?
-
Technical Analysis: Beyond the daily chart, a technical analyst would look at moving averages, RSI (Relative Strength Index), MACD (Moving Average Convergence Divergence), and other indicators across different timeframes to identify trends, momentum, and potential entry/exit points for traders.
-
Fundamental Analysis: A deeper fundamental analysis would involve reviewing Meta’s financial statements (income statement, balance sheet, cash flow statement), earnings reports, and management commentary to understand its underlying business health and financial performance.
The provided chart serves as a concise yet rich source of information, offering immediate insights into Meta Platforms Inc.’s recent stock performance and key valuation metrics. While it doesn’t provide a complete picture, it lays the groundwork for a more extensive and multifaceted exploration of the company’s financial standing and market dynamics.