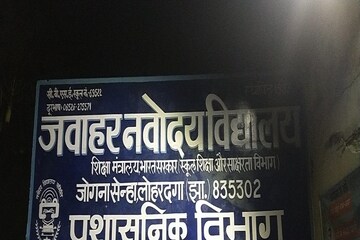
News

Amazon Stock Outlook: Pre-Market Surge Hints at Rebound After Daily Dip

SEATTLE – Amazon stock (NASDAQ: AMZN) ended the trading day in the red, but a significant pre-market surge is giving traders a reason for optimism heading into Monday’s session. While the daily chart reflects selling pressure, after-hours activity suggests that buyers are ready to step back in, setting up a pivotal start to the new trading week.

A Tale of Two Halves: The Trading Session in Review

Amazon Inc. closed at

0.78 (0.37%). However, the closing price doesn’t tell the whole story.


The day began on a high note, with the stock opening at $214.62 and quickly touching the day’s peak of $216.03. From there, sellers dominated the morning session, driving the price down steadily. The stock broke through the previous day’s close of

211.11** in the early afternoon.


Crucially, unlike a stock in freefall, AMZN did not continue to plunge. Instead, it found solid support around the

212 range and spent the latter half of the day consolidating, moving sideways in a tight channel. This basing action often indicates that selling pressure is exhausted.


The most compelling piece of data for traders is the pre-market activity, which shows the stock at

1.11 (0.52%). This strong move upwards after the close suggests a potential reversal is in the works.


Key Financial Metrics: A Trader’s Checklist

  • P/E Ratio (34.57): Amazon’s P/E ratio is characteristic of a major technology and growth company. While not low, it reflects investor confidence in future earnings from its diverse business segments like AWS, advertising, and e-commerce.

  • 52-Week Range ($151.61 – $242.52): The current price of $211.99 places the stock firmly in the upper tier of its annual range, signaling strong underlying performance over the past year.

  • Dividend Yield (-): As a growth-focused company, Amazon does not currently pay a dividend, reinvesting its profits back into the business. This is a key consideration for income-focused investors.

  • Market Cap (2.25LCr): As one of the world’s largest companies by market capitalization, Amazon is a cornerstone of many portfolios and a key bellwether for the tech sector and the broader market. (Note: “LCr” is a regional notation; this represents a market cap in the trillions of USD).

Market Outlook for Monday: Will the Stock Go Up or Down?

The data presents a compelling case for a bullish open on Monday, primarily driven by the strong pre-market rally.

The Bullish Case: The pre-market jump to $213.10 is the most significant bullish signal. It indicates that buyers view the dip below $212 as an attractive entry point. The fact that the stock found a firm bottom at $211.11 and consolidated rather than continuing to fall further strengthens this case. The first key resistance level to watch will be the day’s opening price of $214.62. A break above this could signal a return to the day’s highs.

The Bearish Case: Despite the optimism, traders should remain cautious. The stock did close lower on the day. If the pre-market gains fade at the opening bell and the price drops back below the previous close of $212.77, it could invalidate the bullish signal. A definitive break below the day’s low and key support level of $211.11 would be a very bearish sign, suggesting the downward trend is set to continue.

Is It Right to Invest Today?

For the short-term trader, the pre-market action provides a strong lean towards a bullish start on Monday. A strategy could involve watching to see if the stock can hold its pre-market gains and push past the $213 level at the open. The risk is managed by watching the key support level at $211.11.

For the long-term investor, a minor daily fluctuation is less important than the company’s fundamental strength. For those bullish on Amazon’s dominance in cloud computing and e-commerce, this dip could represent a tactical opportunity to add to a position at a slightly lower price than where it was trading just hours earlier.

Disclaimer: This article is an analysis based on historical data from the provided image and is for informational purposes only. It is not financial advice. Stock market performance is subject to numerous external factors, and past performance is not an indicator of future results. Always conduct your own research and consult with a qualified financial advisor before making any investment decisions.

Back to top button
close