
Broadcom stock (often traded under the ticker AVGO) experienced a day of intense volatility on Monday, June 20, leaving traders to decipher mixed signals. Despite a significant intraday plunge, the semiconductor company managed to claw back most of its losses, but ultimately closed in the red, raising questions about its direction for the upcoming trading day.
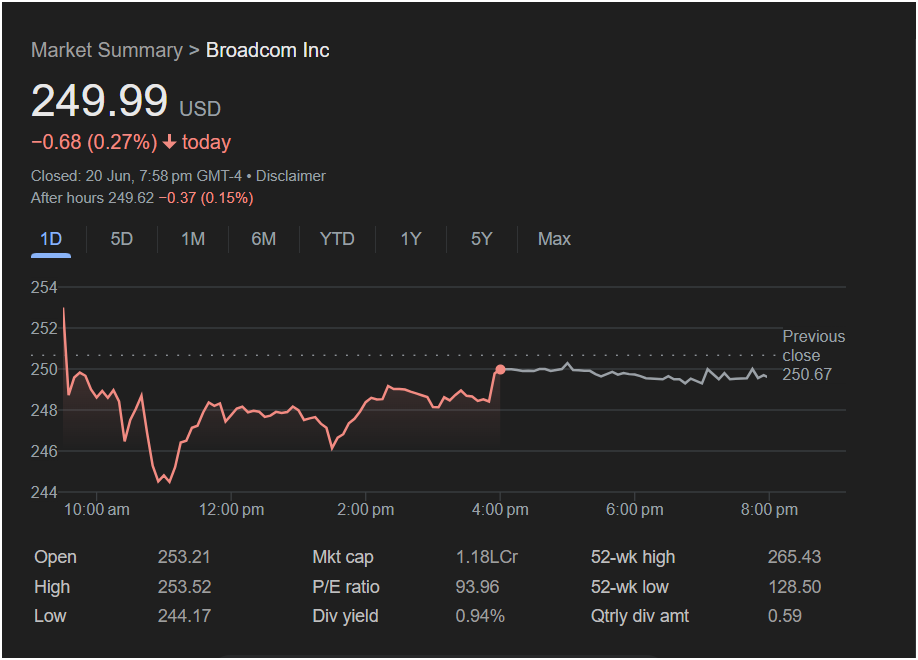
Broadcom Inc. finished the main trading session at 249.99 USD, marking a modest loss of $0.68 (0.27%). However, the selling pressure continued into after-hours trading, where the stock slipped another $0.37 (0.15%) to $249.62, indicating some lingering bearish sentiment.
 A Rollercoaster Day for Traders
The small net change for the day belies a dramatic battle between buyers and sellers. An analysis of the 1-day chart reveals a turbulent session:
-
Bullish Start, Sharp Reversal: The stock opened strong at $253.21, gapping up from the previous close of $250.67. It immediately pushed to the day’s high of $253.52 before facing a wall of sellers.
-
Mid-Morning Plunge: In a sharp reversal, the stock plummeted throughout the morning, hitting its intraday low of $244.17. This represents a drop of over $9 from its daily high.
-
Afternoon Recovery: Buyers stepped in at the lows, initiating a steady but choppy recovery for the rest of the day. The stock fought its way back toward the $250 level, showing resilience.
This price action—a strong open followed by a steep sell-off and partial recovery—suggests significant indecision in the market.
Key Metrics Every Trader Should Know
For a complete picture, traders must consider the fundamental data from the session:
-
Open: 253.21
-
High: 253.52
-
Low: 244.17
-
Previous Close: 250.67
-
Market Cap: 1.18LCr
-
P/E Ratio: 93.96 (A high P/E ratio, suggesting that the market has high expectations for Broadcom’s future earnings growth).
-
52-Week Range: The stock is trading near its 52-week high of $265.43, and is significantly above its low of $128.50.
-
Dividend Yield: 0.94% (A respectable dividend for a major tech company).
Should You Invest in Broadcom Today?
The decision to invest after Monday’s session is complex, as the chart presents both bullish and bearish arguments.
The Bullish Case: The strong recovery from the day’s low of $244.17 is a positive sign. It shows that buyers were willing to defend that price level, establishing it as a strong area of support. A long-term investor might see this dip as a buying opportunity.
The Bearish Case: The stock’s failure to hold its opening gains and the subsequent after-hours dip suggest that sellers are still active. The day’s high of $253.52 now acts as a key resistance level. Until the stock can decisively break above this level, upside may be limited.
for Traders:
Investing immediately might be a risky move given the evident volatility.
-
A conservative approach would be to wait for more confirmation. A break and hold above the $253.52 resistance level could signal a resumption of the uptrend.
-
Conversely, a break below the $244.17 support level could trigger another leg down.
The battle lines are clearly drawn. Traders should watch these key levels closely in the next session to gauge whether the bulls or the bears will take control of Broadcom’s stock price.
Disclaimer: This article is for informational purposes only and is not financial advice. All investment decisions should be made with the help of a qualified financial professional.

