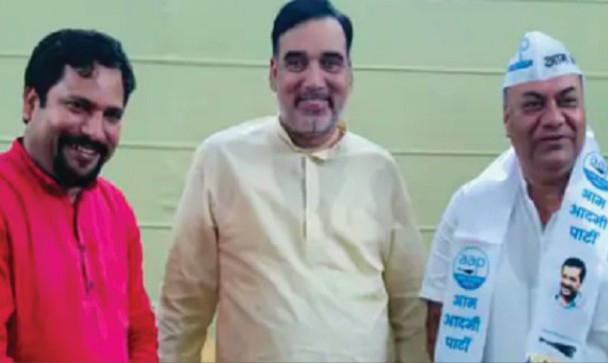
News

Amazon Stock Plummets: What Traders Should Watch for AMZN on Monday

Amazon.com Inc. (NASDAQ: AMZN) stock faced significant selling pressure in its last trading session, closing with a notable loss and leaving traders questioning its direction for the upcoming week. The tech giant’s performance showed sustained weakness throughout the day, a trend that warrants a close look before the market opens on Monday.

This article provides a comprehensive analysis of Amazon’s recent trading activity and outlines the critical levels and scenarios for traders to monitor.

A Detailed Look at the Day’s Trading

Amazon stock concluded the day at

3.91, or 1.75%. This bearish performance wiped out earlier gains and points to strong control by sellers.


The key statistics from the trading session tell a clear story:

  • Open: $223.52

  • Day’s High: $223.82

  • Day’s Low: $219.12

  • Previous Close: $223.30

The stock opened slightly above its previous close but immediately began a steady descent. Unlike a volatile session with dips and recoveries, the chart shows a persistent downward trend for most of the day. After hitting its low of $219.12, the stock failed to mount any meaningful recovery, instead consolidating in a narrow range near its lows for the remainder of the afternoon. Closing near the bottom of the day’s range is a technically weak signal, often suggesting that bearish sentiment may carry over.

Crucial Metrics for Amazon Traders

To form a complete trading strategy, it’s vital to consider the broader context:

  • 52-Week Range: The stock is trading between its 52-week high of $242.52 and low of $151.61. While the recent drop is sharp, the stock remains significantly above its yearly low.

  • P/E Ratio: At 35.78, Amazon’s Price-to-Earnings ratio reflects investor expectations for future growth, which is typical for a major technology firm.

  • Pre-Market Activity: Pre-market data shows the stock at $219.38, a virtually flat change. This indicates a lack of immediate buying or selling pressure before the opening bell, suggesting traders are waiting for the market to open to set the direction.

Will Amazon Stock Go Up or Down on Monday?

Based on the technical signals from the last session, caution is warranted.

The Bearish Case (Potential for a Downward Move):
The primary indicator is the weak close near the day’s low. This suggests that sellers were in control right until the end of the session, and there wasn’t enough buying pressure to support the price. For Monday, the most critical level to watch will be the intraday low of $219.12. If Amazon stock breaks below this support level, it could trigger further selling and signal a continuation of the downtrend.

The Bullish Case (Potential for a Reversal):
A reversal is always possible, especially if the broader market sentiment turns positive. Some traders may view the drop to the $219 level as a buying opportunity. The first sign of strength would be if the stock can hold above the

220 psychological level**. A sustained move above this could indicate that buyers are stepping in, potentially leading to a relief rally back towards the previous close of $223.30.


Is It a Good Time to Invest?

The decision to invest on Monday depends heavily on your trading style and risk appetite.

  • For Short-Term Traders: The current momentum is bearish. Attempting to buy at the open without a clear sign of a reversal is often referred to as “catching a falling knife” and carries significant risk. It would be prudent to wait for the price to stabilize or show a confirmed bounce before entering a long position.

  • For Long-Term Investors: A price drop in a fundamentally strong company like Amazon can be seen as a long-term buying opportunity. However, given the sharp downward momentum, the stock could potentially see further declines before finding a bottom.

In summary, Amazon stock is entering the new week on a weak footing. The inability to recover from its intraday low is a red flag. Traders should be highly attentive to the $219.12 support level on Monday, as a break below it could dictate a continued bearish trend for the session.


Disclaimer: This article is based on the analysis of the provided image and is for informational purposes only. It does not constitute financial advice. All investors should conduct their own research and consult with a qualified financial advisor before making any investment decisions.

Back to top button
close