Breaking Newsट्रेंडिंगदेश -विदेशसियासतस्लाइडर

बड़ी खबर : NDA ने किया राष्ट्रपति पद के उम्मीदवार का ऐलान… 20 नामों पर लंबे दौर की चर्चा के बाद इनके नाम पर लगी मुहर…
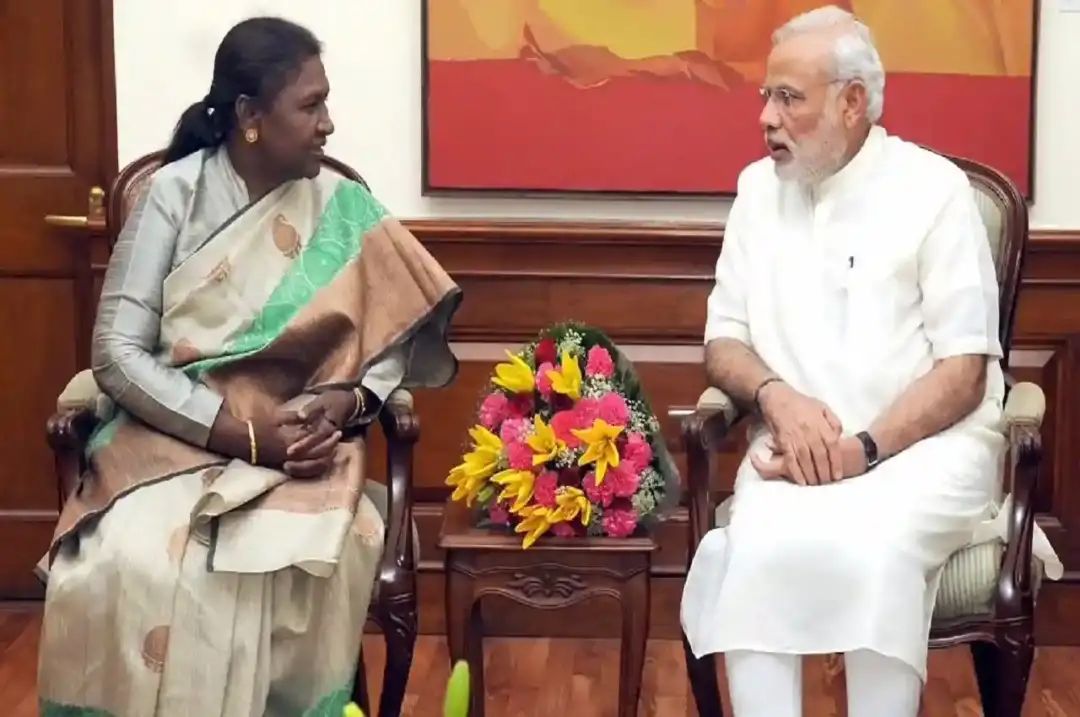
नई दिल्ली: एनडीए ने मंगलवार को राष्ट्रपति पद के उम्मीदवार के नाम का ऐलान कर दिया। BJP अध्यक्ष जेपी नड्डा ने प्रेस कॉन्फ्रेंस कर द्रौपदी मुर्मू के नाम पर मुहर लगाई।
बीजेपी पार्लियामेंट्री बोर्ड की बैठक में उनका नाम फाइनल किया गया। जेपी नड्डा ने कहा, आज की बैठक में एनडीए ने सभी घटक दलों के साथ बातचीत करते हुए 20 नामों पर लंबे दौर की चर्चा हुई।
चर्चा में सभी के साथ बातचीत करते हुए ये बात सामने आई कि प्रत्याशी के रूप में किसी पूर्वी क्षेत्र से उम्मीदवार चुनना चाहिए।
BJP National President Shri @JPNadda addresses a press conference at BJP headquarters in New Delhi. https://t.co/Xk697XV3CB
— BJP (@BJP4India) June 21, 2022


