AT&T Stock Analysis: T Trades Sideways Near Highs, Is the Dividend the Real Story

AT&T Inc (T) stock concluded its latest trading session with little fanfare, closing nearly flat in a day marked by indecisive, choppy price action. While the chart may look uneventful to momentum traders, an analysis of the key metrics reveals why this telecommunications giant remains a focal point for a different class of investors.
Today’s Market Performance: A Picture of Indecision
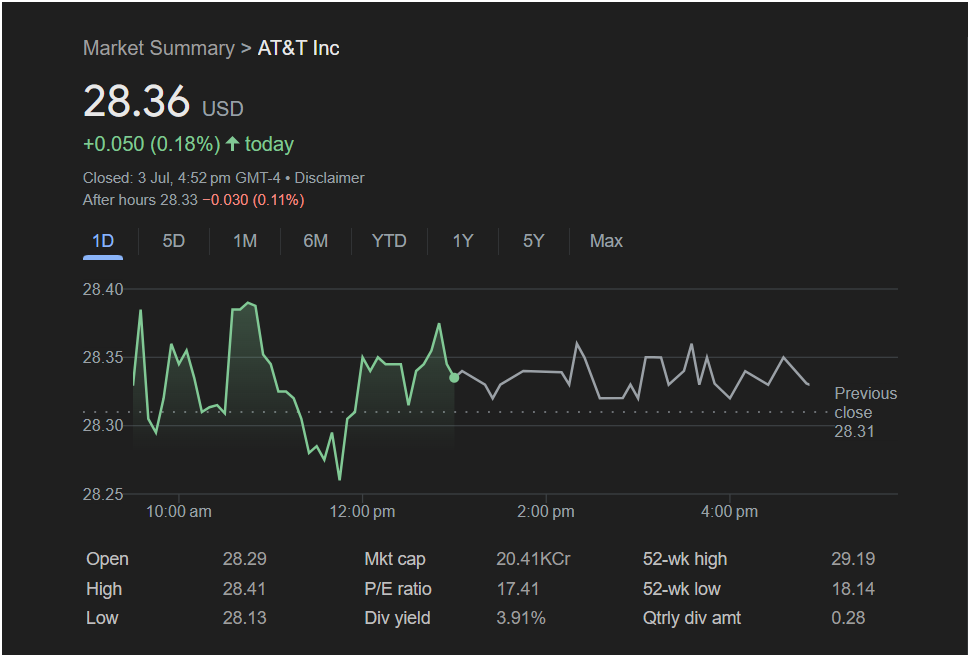
AT&T stock ended the day at
0.050, or 0.18%. The stock essentially treaded water around its previous close of $28.31, signaling a perfect balance between buyers and sellers.
The 1-day chart illustrates a classic range-bound session:
-
Volatile but Directionless: The stock opened at
28.13** and the high of $28.41.
-
No Clear Trend: Unlike a trending stock, AT&T showed no sustained upward or downward momentum. The price action was choppy, suggesting that neither bulls nor bears could gain a clear advantage.
-
Afternoon Calm: The volatility decreased in the latter half of the day as the stock settled into an even tighter trading range, reinforcing the market’s state of indecision.
The after-hours session saw a minor dip to $28.33, a move too small to provide any directional clues.
Key Data for Traders
For investors evaluating AT&T, the story isn’t in the day’s price change, but in the underlying fundamentals:
-
Previous Close: $28.31
-
Day’s Range: $28.13 (Low) to $28.41 (High)
-
P/E Ratio: 17.41
-
Dividend Yield: 3.91%
-
52-Week Range: $18.14 – $29.19
Two data points are critical here. First, the stock is trading very close to its 52-week high of $29.19, indicating a strong performance over the past year. Second, and most importantly for many, is the robust dividend yield of 3.91%. This makes AT&T a powerhouse for income-seeking investors.
Outlook for the Next Trading Day (Monday)
The tight trading range has established very clear support and resistance levels for traders to watch.
The Bullish Case:
Consolidating near a 52-week high can be a sign of strength, as the stock builds a base for its next move up. For a bullish breakout, traders need to see a decisive move and close above the day’s high of $28.41. This would open the door to a test of the 52-week high at $29.19.
The Bearish Case:
The lack of momentum to push higher could be interpreted as exhaustion. If sellers take control, the first key level to watch is the day’s low of $28.13. A break below this support level would signal that the stock is ready for a pullback and could attract more selling pressure.
Is It Right to Invest Today?
Your investment decision for AT&T should be guided by your strategy.
-
For Short-Term Traders: The current sideways market offers little opportunity. The risk/reward is poor for making a trade within this tight range. Prudent traders will likely wait on the sidelines for a confirmed breakout above $28.41 or a breakdown below $28.13 before committing capital.
-
For Long-Term Income Investors: This is where AT&T shines. The day-to-day price fluctuations are secondary to the substantial dividend yield. For these investors, the stock remains a core holding for income generation. The current price near a 52-week high might suggest waiting for a potential dip to lock in a slightly better yield, but the overall stability is a key part of its appeal.
In summary, AT&T stock is currently in a holding pattern. While short-term traders should exercise patience, the compelling dividend yield ensures the stock will remain a favorite among income-focused investors, regardless of the minor daily price swings.
Disclaimer: This article is for informational purposes only and is based on the analysis of the provided image. It does not constitute financial advice. All trading and investment decisions should be made based on your own research and consultation with a qualified financial advisor.


