
Bank of America Corp (BAC) ended the last trading day with a modest gain, but the closing price doesn’t tell the whole story. The stock reached a critical milestone—its 52-week high—only to be met with immediate selling pressure. This price action has created a crucial battleground, leaving traders to question whether the stock has the strength to break out or if a pullback is on the horizon. This analysis will dissect the chart and provide a clear outlook for the week ahead.
Friday’s Trading Session: A Day of Rejection
While Bank of America closed in the green on Friday, July 3rd, the intraday price action was defined by a significant rejection at a key level. Here are the vital stats:
-
Closing Price:
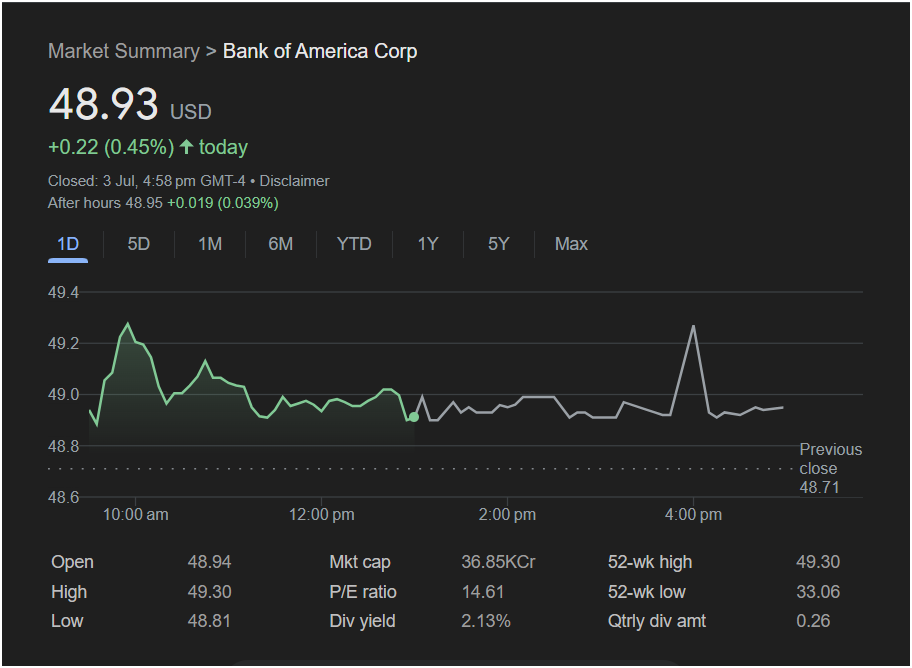
0.22 (+0.45%).
-
After-Hours Trading: The stock edged up slightly to $48.95, showing minimal movement after the bell.
-
Day’s Range: BAC opened at $48.94, hit a low of
49.30**.
The intraday chart shows a burst of activity at the open, with the stock quickly surging to $49.30. This price is not just the high of the day; it is also the 52-week high. Upon touching this level, the stock was immediately and sharply rejected, falling back below $49.00 within the first hour. For the remainder of the day, the stock traded in a very tight, choppy sideways range, signaling indecision and a stalemate between buyers and sellers.
Key Takeaways for Traders
1. The
49.30 level. When a stock hits its 52-week high and immediately sells off, it establishes that level as a powerful point of resistance. This is now the key ceiling that bulls must break through to regain momentum.
2. Indecisive Sideways Trading:
The flat, range-bound price action for most of the afternoon indicates a lack of conviction. After the initial rejection, neither buyers nor sellers could take decisive control, leading to a “wait-and-see” market posture. This suggests the stock may need a new catalyst to break out of this tight range.
3. Solid Fundamentals Provide Support:
While the technical picture shows weakness at resistance, the fundamentals remain solid:
-
P/E Ratio: At 14.61, Bank of America’s valuation is reasonable and in line with the banking sector, suggesting the stock is not in a speculative bubble.
-
Dividend Yield: A healthy 2.13% dividend yield provides an incentive for long-term investors to hold the stock, which can create a floor of support under the price.
Market Outlook: Will Bank of America Stock Go Up or Down on Monday?
Given the sharp rejection at its yearly high, the short-term outlook for Bank of America stock is cautious.
The Bearish Case (More Likely Scenario):
The failure to break and hold the 52-week high is a classic bearish signal. The path of least resistance in the short term may be downward. Traders will be watching to see if the stock breaks below the day’s low of
48.71. A move below these support levels would confirm that sellers are in control and could lead to a deeper pullback.
The Bullish Case:
For the bulls to reassert control, they face a significant challenge. They would need to gather enough strength to push the stock not just to, but through the $49.30 resistance level on strong volume. A sustained close above this price would invalidate the rejection signal and open the door for price discovery to new highs.
Is It Right to Invest Today?
The right approach depends on your investment timeline and risk appetite.
-
For the Day Trader: The range between
49.30 (resistance) defines the immediate playing field. Trading within this choppy range could be difficult. A clearer opportunity would present itself on a confirmed break of either level.
-
For the Swing Trader: Caution is highly advised. The rejection at the 52-week high is a bearish technical signal. It may be prudent to wait on the sidelines to see if the stock can successfully break out or if it pulls back to a more attractive entry point.
-
For the Long-Term Investor: The fundamental story for Bank of America remains intact. A short-term pullback from the 52-week high could be seen as a welcome opportunity to add to or initiate a position at a better price.
In conclusion, Bank of America stock is at a critical technical inflection point. While it closed with a gain, the failure at its 52-week high is a significant warning sign. The market’s reaction to the $49.30 resistance level on Monday will set the tone for the week ahead.
Disclaimer: This article is for informational purposes only and is not financial advice. All trading and investment decisions should be made with the consultation of a qualified financial professional and after conducting your own research.


