
Wells Fargo & Co stock captured significant investor attention during its last session, closing with a robust gain and, more importantly, touching a new 52-week high. An analysis of the price action from Wednesday, July 3rd, reveals critical levels that traders must watch heading into next week.
Today’s Market Performance: A Test of New Highs
Wells Fargo stock closed the day at
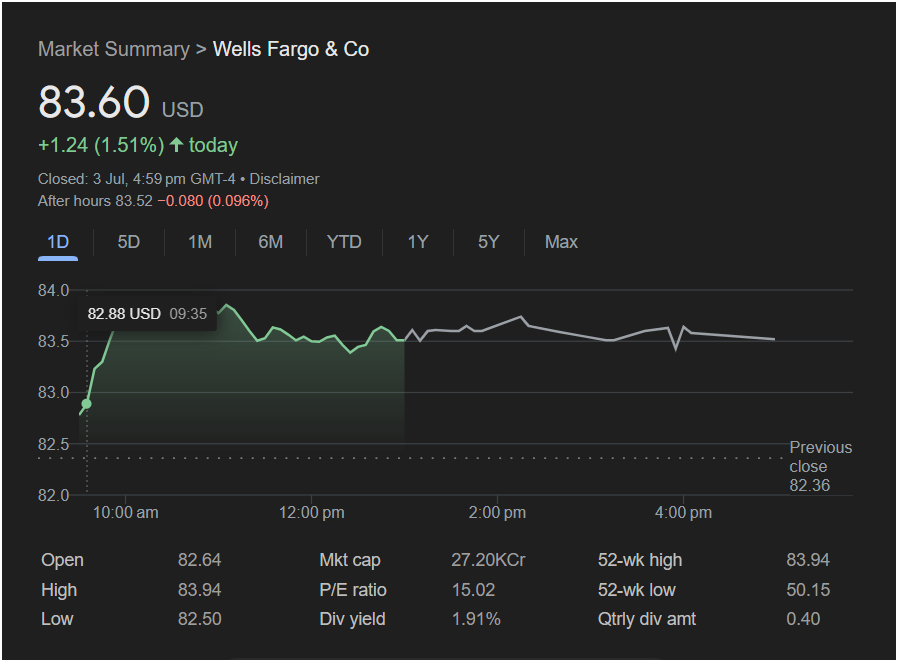
1.24, or 1.51%. The session was a testament to the strong bullish sentiment surrounding the financial giant.
The intraday chart tells a story of an early surge and a later test of conviction:
-
Strong Open: The stock opened at $82.64, above the previous close of $82.36, and after a brief dip to the day’s low of $82.50, it began a powerful rally.
-
Hitting a Milestone: The buying pressure drove the stock to a session high of $83.94. This is the most significant event of the day, as this price marks a new 52-week high for the stock.
-
Afternoon Pullback: After reaching this peak, the stock did not continue its ascent. Instead, it faced selling pressure or profit-taking, causing it to pull back and consolidate for the rest of the day, closing 34 cents below its high.
The after-hours session saw a minor dip to $83.52, a negligible move that suggests the market is waiting for the next session to determine direction.
Key Data for Traders
To craft a strategy, traders should focus on these essential figures from the session:
-
Previous Close: $82.36
-
Open: $82.64
-
Day’s Range: $82.50 (Low) to $83.94 (High)
-
Market Cap: $27.20 KCr (translates to approx. $272 Billion USD)
-
P/E Ratio: 15.02
-
Dividend Yield: 1.91%
-
52-Week High: $83.94
-
52-Week Low: $50.15
The most crucial piece of data is that the day’s high and the 52-week high are the same. This makes $83.94 a pivotal price level. Additionally, a P/E ratio of 15.02 suggests a reasonable valuation for a major bank.
Outlook for the Next Trading Day (Monday)
The price action at the 52-week high creates a very clear technical picture for Monday.
The Bullish Case:
Reaching a new 52-week high is inherently bullish and confirms a strong uptrend. For the rally to continue, bulls need to show their strength by pushing the price decisively above the $83.94 resistance level and, critically, holding it there. A close above this level on Monday would signal a successful breakout and could lead to further upward movement.
The Bearish Case:
The failure to close near the session high after touching the 52-week peak is a classic sign of a potential reversal or “bull trap.” It indicates that sellers are active at this new high. If the stock attempts to rally on Monday but is once again rejected at or near $83.94, it could trigger a significant pullback as buyers lose confidence.
Is It Right to Invest Today?
This is a critical juncture for Wells Fargo stock, making the investment decision highly dependent on your risk tolerance and strategy.
-
For Short-Term Traders: The signal is mixed. An aggressive trader might see the pullback from the high as a buying opportunity in anticipation of a breakout. However, a more cautious approach would be to wait for confirmation. A trade could be triggered by a sustained move above $83.94 (a buy) or a clear failure at that level (a potential short).
-
For Long-Term Investors: Hitting a new 52-week high is a positive development. For those with a longer time horizon, the moderate P/E ratio and dividend yield make the stock fundamentally attractive. A minor pullback from a new high is less concerning than the overall upward trend.
In summary, Wells Fargo stock is at a pivotal moment. Its ability to conquer the $83.94 resistance will determine its short-term fate. All eyes will be on this level at the market open on Monday.
Disclaimer: This article is for informational purposes only and is based on the analysis of the provided image. It does not constitute financial advice. All trading and investment decisions should be made based on your own research and consultation with a qualified financial advisor.

