
Procter & Gamble Co (PG), a stalwart in the consumer staples sector, ended Wednesday’s trading session in the red, and a detailed look at the day’s price action suggests that bearish sentiment may have the upper hand heading into Monday’s market open. Investors looking at PG stock should be aware of the key technical signals that emerged from the recent session.
Here is a full breakdown of the data and what it could mean for the stock’s direction next week.
A Closer Look at Wednesday’s Performance
Procter & Gamble stock closed the day at
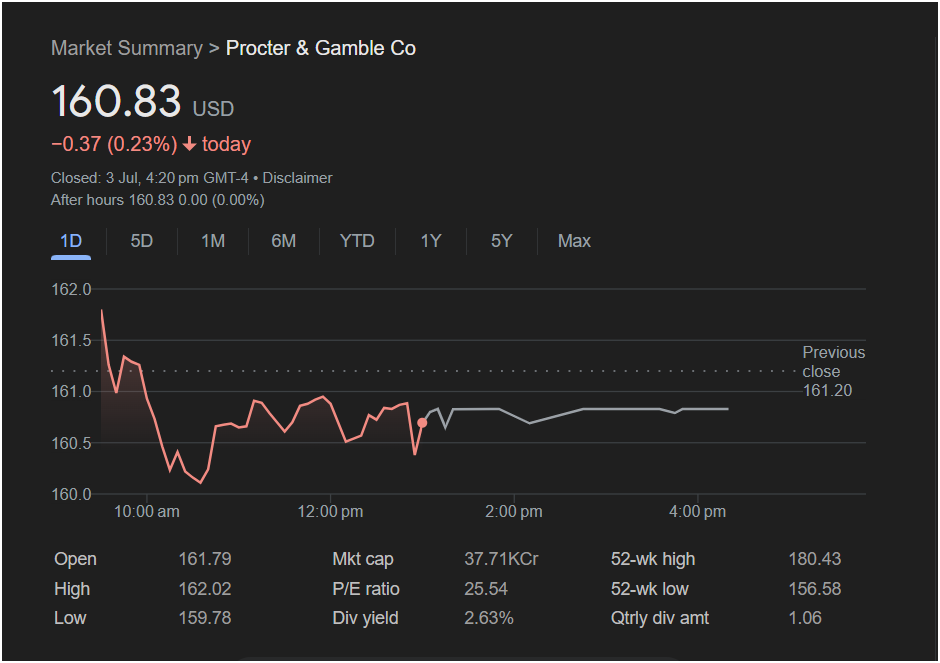
0.37 (0.23%). While a minor loss on the surface, the intraday chart reveals a story of significant selling pressure:
-
Open: $161.79
-
High: $162.02
-
Low: $159.78
-
Previous Close: $161.20
The stock gapped up at the open, starting the day with apparent strength above its previous close. However, that strength was short-lived. Sellers immediately took control, pushing the price down sharply to its session low of $159.78 in the first hour of trading.
Although the stock managed to find a floor at this level and claw back some of its losses, it spent the remainder of the day trading sideways, unable to reclaim the $161 mark with any conviction. The fact that it closed significantly below its opening price points to a clear bearish victory for the session. Notably, after-hours trading was flat at $160.83, offering no immediate directional bias.
Key Financial Metrics for Context
Understanding the fundamental data is crucial for any trader analyzing PG stock:
-
Market Cap: 37.71KCr (This represents approximately $377.1 Billion USD), solidifying its position as a global consumer goods giant.
-
P/E Ratio: 25.54. This is a stable valuation for a mature, profitable company like P&G.
-
Dividend Yield: 2.63%. This substantial yield is a key attraction for income-focused investors and can often provide a level of price support.
-
52-Week Range: The stock has traded between
180.43. The current price is in the upper half of this range, but well off its highs.
-
Quarterly Dividend: $1.06 per share, highlighting its commitment to shareholder returns.
Will PG Stock Rise or Fall on Monday?
Based on the technical signals from the provided chart, here’s what traders should be watching.
The Bearish Case (Potential for a Downturn):
The primary bearish signal is the “gap and fade” pattern seen on Wednesday. The stock’s failure to hold its opening gains is a classic sign of weakness, suggesting that institutions or large traders were using the initial strength to sell their positions. The closing price near the lower end of the day’s range reinforces this negative sentiment. If this momentum continues, the stock could test its recent low of
156.58.
The Bullish Case (Potential for a Rebound):
The optimistic view rests on the support found at
161.20 (previous close) resistance level.
Conclusion for Investors:
So, is it right to invest today? The immediate outlook for Procter & Gamble stock is cautious. The bearish intraday price action on Wednesday is a significant red flag that traders cannot ignore. While the stock’s defensive qualities and dividend yield provide a safety net, the path of least resistance appears to be to the downside in the very short term.
Key levels for traders to monitor on Monday:
-
Critical Support: The intraday low of $159.78.
-
Initial Resistance: The
161.20.
Prudent traders may want to see if the support level at $159.78 holds at the start of next week’s session before considering a long position. A decisive break below this level would signal further weakness.
Disclaimer: This article is an analysis based on the provided image and is for informational purposes only. It is not financial advice. All stock market trading and investment activities involve risk. You should conduct your own research and consult with a qualified financial professional before making any investment decisions.


