
PURCHASE, NY – Mastercard Inc. (NYSE: MA) stock is presenting a constructive picture for traders heading into Monday’s session, backed by a strong intraday rally and a positive pre-market indication. While the stock officially closed with no net change, the underlying momentum during the trading day suggests buyers were in control, setting up a potentially bullish open.
This article provides a complete breakdown of the data from the latest trading session to help investors and traders decide if it is right to invest today.
A Day of Bullish Momentum
The one-day chart for Mastercard paints a very different picture than its 0.00% closing change might suggest. The session was characterized by a clear and sustained uptrend.
The stock opened near its low for the day, around the
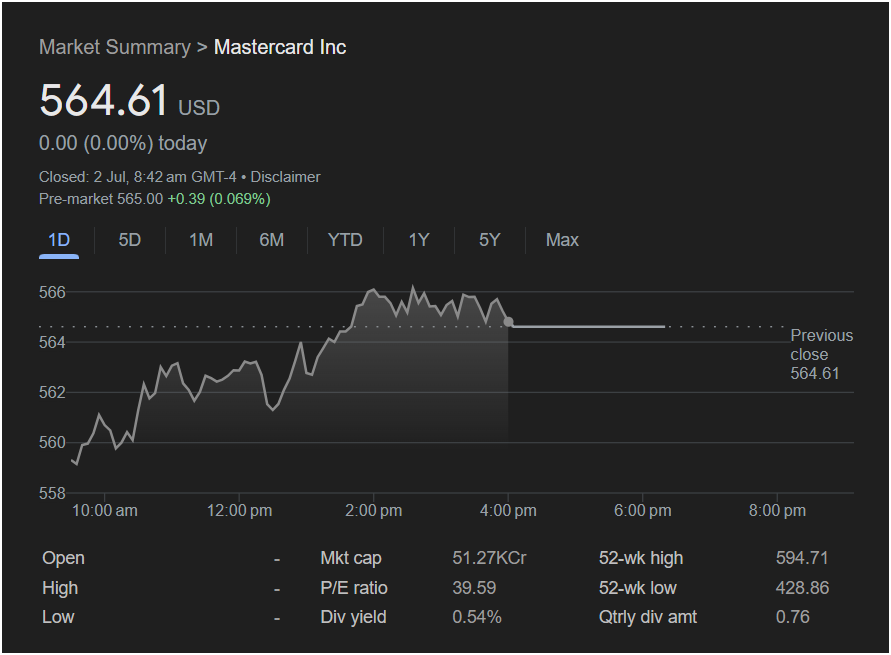
559 level. From there, buyers stepped in decisively, pushing the price steadily higher throughout the morning and into the afternoon. It reached an intraday peak of approximately $566 before entering a period of healthy consolidation. It eventually settled at its previous close of $564.61. This price action—a strong rally followed by consolidation at the highs—is technically a bullish signal.
The Pre-Market Signal: A Gentle Push Upward
Adding to the positive sentiment is the pre-market activity. As of the last update shown (8:42 am GMT-4), Mastercard stock was trading at $565.00.
-
Change: Up $0.39
-
Percentage: Up 0.069%
While modest, this pre-market gain is significant because it reinforces the bullish momentum from the previous session. It indicates that buying interest has carried over after hours and could lead to a higher open on Monday.
Key Financial Metrics for Traders
To fully understand the potential trade, it’s essential to look at Mastercard’s core financial data:
-
Market Cap: 51.27KCr: This represents a massive market capitalization, solidifying Mastercard’s position as a global financial services behemoth whose performance is a key indicator of consumer spending health.
-
P/E Ratio: 39.59: This is a solid Price-to-Earnings ratio for a blue-chip growth company. It suggests that while investors expect future growth, the valuation is not overly stretched.
-
52-Week High/Low: $594.71 / $428.86: This is a crucial piece of information. The current price of $564.61 is firmly in the upper end of its yearly range, confirming a strong long-term uptrend. Importantly, there is still a meaningful gap before it reaches its 52-week high, suggesting room for the stock to run before hitting major resistance.
-
Dividend Yield: 0.54% (Qtrly Div Amt: 0.76): The company pays a dividend, offering a small but reliable return to shareholders.
Will the Market Go Up or Down on Monday?
All signs from this snapshot point towards a continuation of the upward trend, but traders should remain strategic.
The Bullish Case:
The evidence is strong. A powerful intraday rally, consolidation near the highs, and a positive pre-market follow-through create a compelling bullish setup. The stock has clear momentum, and with the 52-week high still some distance away at $594.71, there’s a clear target for bulls to aim for.
The Bearish Case:
The only note of caution is the intraday high around the $566 level. This point, where the rally paused, now becomes the first line of short-term resistance. If the stock fails to break through this level on Monday, it could pull back to consolidate further before attempting another move higher.
Verdict for Monday:
The outlook for Mastercard stock appears constructive. However, it is not right to invest today without a clear strategy. The key level to watch at the market open is the intraday high of ~$566.
A decisive break above $566 on good volume would be a strong confirmation of the bullish trend and could signal the start of the next leg up towards the $590s. If the stock struggles to overcome this level, patient traders might wait for a small pullback to find a better entry point. The overall technical picture, based on this data, favors the buyers.
Disclaimer: This article is for informational purposes only and is based on an analysis of the provided image. It does not constitute financial advice. All investment decisions should be made based on your own research and consultation with a qualified financial advisor. Stock markets are volatile, and past performance is not indicative of future results.


