
NEW YORK – AbbVie Inc. (NYSE: ABBV) is capturing trader attention this morning as its stock opened the trading session with a slight dip. As of 9:30 AM GMT-4 on July 2nd, the pharmaceutical giant’s stock is trading at $189.83, down a marginal $0.16 or 0.084%.
This price action places the stock just below its previous closing price of $189.99, a critical psychological and technical level. For traders deciding on their next move, a deep dive into the technical chart and fundamental data is essential. Here’s a full breakdown of what the numbers are telling us.
Technical Analysis: A Tug-of-War Around the $190 Mark
The 1-day chart, which reflects the previous day’s trading, shows a story of bullish momentum followed by consolidation. The stock experienced a strong rally from a low near $185 to a peak just shy of $192 before settling into a sideways pattern for the remainder of the day.
Key technical levels for traders to watch today are:
-
Immediate Resistance: The previous day’s high around $191.50 – $192.00. A decisive break above this level could signal a continuation of the prior day’s bullish trend.
-
Key Pivot Point: The previous close of $189.99. The stock is currently battling at this level. Holding above it would be a sign of strength, while continued trading below it may invite selling pressure.
-
Immediate Support: The previous day’s consolidation range around $188.50. If the stock fails to hold its current levels, this is the first area where buyers might step in.
Fundamental Snapshot: A Mixed Bag of Value and Growth
Beyond the immediate price action, the underlying fundamentals provide a more comprehensive picture for potential investors.
-
Market Cap: With a market capitalization of approximately $335.6 Billion (33.56KCr), AbbVie is a large-cap stalwart in the healthcare sector, suggesting a degree of stability compared to smaller-cap stocks.
-
Valuation (P/E Ratio): The P/E ratio stands at 81.01. This is a significantly high valuation, indicating that investors have high growth expectations priced in or that the stock could be considered expensive on an earnings basis. This is a critical point of caution for value-oriented investors.
-
Dividend Yield: AbbVie offers an attractive dividend yield of 3.45%, with a quarterly payout of $1.64 per share. This strong yield is a major draw for income-focused investors and can provide a cushion during periods of market volatility.
-
52-Week Range: The stock is trading between its 52-week low of
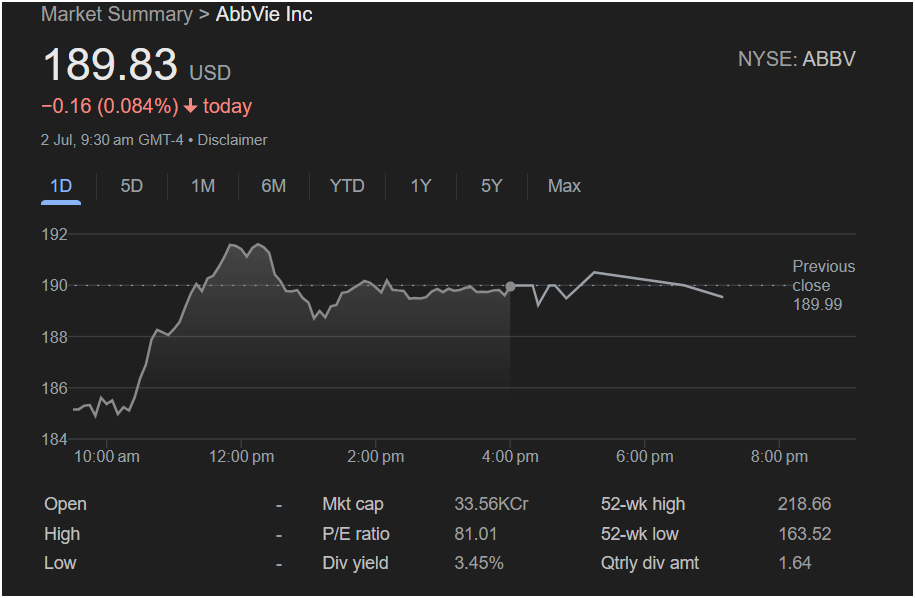
218.66. At its current price of ~$190, it sits in the lower half of this range, suggesting there could be significant upside potential if the company executes well and market sentiment turns positive.
Will the Stock Go Up or Down? Investor Outlook
The Bullish Case:
Income-seeking investors will find the 3.45% dividend yield highly compelling. From a technical standpoint, if ABBV can reclaim and hold the $190 level, it could build momentum to re-test the previous day’s highs near $192. The stock’s position well off its 52-week high leaves room for potential growth.
The Bearish Case:
The primary concern is the high P/E ratio of 81.01, which may deter investors looking for value. The stock’s failure to hold above the previous close at the opening bell is a minor bearish signal. If sellers take control, the stock could easily drift down to test support levels around $188.50 or lower.
Conclusion: Is It Right to Invest Today?
For a short-term trader, the immediate direction is uncertain. The most prudent strategy would be to watch for a confirmed break above resistance at
192∗∗orabreakdownbelowsupportat∗∗192** or a breakdown below support at **
188.50 before committing to a position.
For a long-term investor, the decision is more nuanced. The high dividend provides a steady income stream, but the high valuation presents a risk. An investment today would be a bet that AbbVie’s future growth can justify its current premium price.
Disclaimer: This article is for informational purposes only and is based on the data available in the provided screenshot. It does not constitute financial advice, a recommendation to buy or sell, or a market prediction. All investors should conduct their own thorough research and consult with a certified financial advisor before making any investment decisions.

