
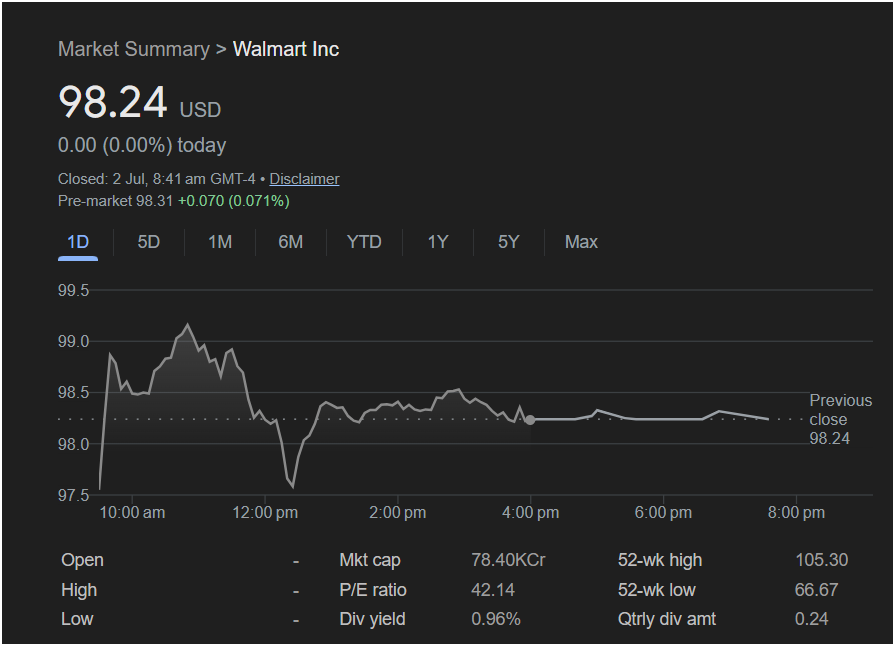
Walmart stock (WMT) is poised for a potentially pivotal trading session on Monday after closing perfectly flat at $98.24 in its last session. While the 0.00% change suggests a day of calm, a closer look at the intraday chart and pre-market activity reveals a more complex picture that traders must understand before making their next move.
This article breaks down all the critical data from the screenshot to provide a clear outlook on whether Walmart stock is a buy, sell, or hold for today.
The Pre-Market Whispers: A Glimpse of Positive Sentiment
The most immediate indicator for Monday’s session is the pre-market activity. As of the time of the data, Walmart stock is trading at $98.31, representing a modest gain of +0.070 (+0.071%).
For traders, this is a cautiously optimistic sign. It suggests that early sentiment is leaning positive, and the stock may open slightly higher than its previous close. While pre-market volumes are typically thin and can sometimes be misleading, this initial upward pressure provides a bullish tilt heading into the opening bell.
A Volatile Day in Review: Unpacking the 1D Chart
The previous trading day was anything but flat. The stock experienced significant volatility, creating key technical levels that traders should watch closely:
-
Intraday High (Resistance): The stock surged to a high above $99.00 before being pushed back down. This level now acts as a key psychological and technical resistance. A strong break above this point on Monday could signal a new bullish leg up.
-
Intraday Low (Support): The price also saw a sharp dip to a low around $97.50. The fact that it recovered strongly from this level indicates that buyers stepped in, establishing it as a critical support zone. If the stock were to fall below $97.50, it could trigger further selling pressure.
-
The Flat Close: Closing exactly at the previous day’s mark of $98.24 after such a rollercoaster session signifies a market in equilibrium. Neither the bulls nor the bears could claim victory, setting the stage for a decisive battle on Monday.
Key Financial Metrics: A Trader’s Checklist
Beyond the chart, the fundamental data provides essential context:
-
P/E Ratio (42.14): A Price-to-Earnings ratio of 42.14 is relatively high. This suggests that the stock is priced for growth and may be considered expensive by value investors. Traders should be aware that high P/E stocks can be more volatile, especially if earnings expectations are not met.
-
52-Week Range ($66.67 – $105.30): Currently trading at $98.24, Walmart is positioned in the upper quadrant of its 52-week range. While this indicates strong performance over the past year, it’s also nearing its peak, which could invite some profit-taking. The next major resistance after the intraday high would be the 52-week high of $105.30.
-
Dividend Yield (0.96%): The modest dividend yield offers a small return for long-term holders but is unlikely to be a primary driver for short-term traders.
Trader’s Outlook for Monday: Should You Invest?
Based on the available data, here is the outlook for Walmart stock today:
The slight pre-market gain suggests a potentially positive open. However, the market’s indecision from the previous session, coupled with the stock trading near its yearly highs and at a high P/E ratio, calls for a strategic approach rather than a blind investment.
The Bullish Case: A trader looking to go long should watch for a sustained break above the $99.00 resistance level. If the stock can clear this hurdle with strong volume, it could indicate momentum to re-test the 52-week high.
The Bearish Case: If the stock fails to hold its opening gains and falls below the
97.50 would be a bearish signal, suggesting the sellers have taken control.
Conclusion: It is not a clear-cut “buy” day at the outset. The most prudent strategy for traders on Monday is to watch the open closely and react to the key levels. The initial positive sentiment from pre-market is a good sign, but confirmation is needed. A move above $99.00 could be a green light to invest for a short-term gain, while a drop below $97.50 would be a clear warning sign.
Disclaimer: This article is for informational purposes only and is not financial advice. All trading and investment decisions carry risk.


