
Home Depot Inc. (HD) stock experienced a volatile trading session, ultimately closing in the red despite a notable recovery from its intraday lows. For traders analyzing the home improvement giant, the day’s price action has established critical support and resistance levels that will likely dictate the stock’s direction at the start of the new trading week.
This analysis breaks down the recent performance of Home Depot stock and what traders should be watching for on Monday.
A Recap of the Day’s Trading
Home Depot stock finished the session at
2.10 (0.57%). However, the closing price doesn’t tell the whole story.
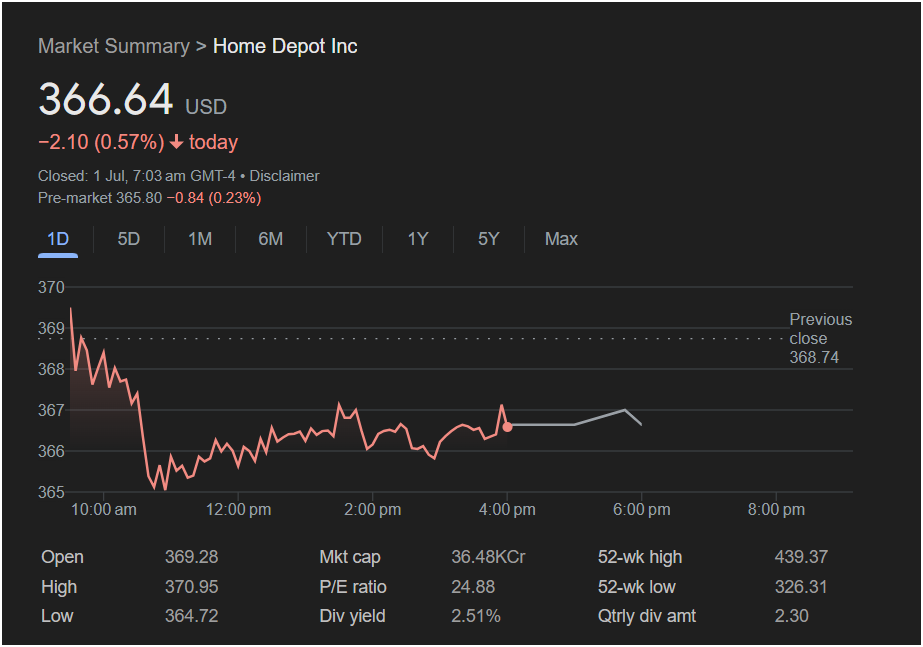
Key data points from the session reveal a tale of two halves:
-
Open: $369.28
-
Day’s High: $370.95
-
Day’s Low: $364.72
-
Previous Close: $368.74
The stock opened higher than its previous close but was immediately met with intense selling pressure, leading to a sharp decline in the morning session to a low of $364.72. Crucially, the stock found strong support at this level. Instead of continuing its descent, it bounced and spent the rest of the afternoon consolidating in a range between roughly $365 and $367. This stabilization after a steep fall is a key technical signal that traders will be watching closely.
Essential Metrics for the Informed Trader
A comprehensive view requires looking beyond the daily chart:
-
52-Week Range: With a range of $326.31 – $439.37, the stock is currently trading significantly below its 52-week high, which may attract value-oriented investors.
-
Dividend Yield: Home Depot offers a substantial dividend yield of 2.51%. This is an attractive feature for income-focused investors and can provide a degree of price support, as buyers may be drawn to the stock on dips to lock in a higher yield.
-
P/E Ratio: A Price-to-Earnings ratio of 24.88 is reasonable for a blue-chip company of this size.
-
Pre-Market Activity: The pre-market shows the stock trading lower at $365.80, a dip of 0.23%. This suggests the bearish sentiment from the initial sell-off may not have fully dissipated.
Will Home Depot Stock Go Up or Down on Monday?
The chart presents compelling arguments for both a potential rise and fall.
The Bullish Case (Potential for an Upward Move):
The strongest bullish signal is the firm support established at the day’s low of
367 mark could signal a reversal, with an initial target of filling the gap back towards the previous close of $368.74.
The Bearish Case (Potential for a Downward Move):
The initial sharp sell-off and the negative pre-market data are significant bearish indicators. The afternoon consolidation could simply be a pause before another move lower. The most critical level to watch is the support at $364.72. A decisive break below this low on Monday would invalidate the support and likely trigger a fresh wave of selling, with traders potentially targeting the next psychological support level.
Is It a Good Time to Invest?
Your investment decision should align with your strategy and risk tolerance.
-
For Short-Term Traders: The situation is at a pivot point. The afternoon consolidation range offers clear levels for trading. The most prudent approach would be to watch the price action around the $364.72 support level. A strong bounce off this level could offer a buying opportunity, while a break below it could be a signal to go short or stay on the sidelines.
-
For Long-Term Investors: A dip in a fundamentally sound company like Home Depot, coupled with its attractive 2.51% dividend yield, can be viewed as a buying opportunity. The price is well off its yearly highs, potentially offering better value. However, it’s wise to be patient and see if the $364.72 support holds before committing capital.
In conclusion, Home Depot stock is at a critical crossroads. The battle between the morning sellers and the afternoon buyers will likely be resolved on Monday. The price action relative to the $364.72 support level will be the most important clue to the stock’s next move.
Disclaimer: This article is based on the analysis of the provided image and is for informational purposes only. It does not constitute financial advice. All investors should conduct their own research and consult with a qualified financial advisor before making any investment decisions.


