
Costco Wholesale Corp. (COST) shares are in the spotlight after a rollercoaster trading session on Thursday, June 27th, that saw the stock hit a significant high before pulling back. Despite the intraday volatility, the stock managed to close in positive territory, setting up a pivotal session for traders on Friday.
Thursday’s Trading Recap: A Battle Between Bulls and Bears
A deep dive into Thursday’s price action reveals a tug-of-war. The stock opened at $982.24, just below the previous close, and dipped to a session low of $980.30 early on. However, buyers quickly stepped in, initiating a powerful rally that pushed the stock to a day’s high of $993.14 around midday.
This peak represented strong bullish momentum, but it was short-lived. Sellers emerged in the afternoon, causing the stock to fade significantly from its highs. Despite this sell-off, Costco showed resilience, finding support and ultimately closing at
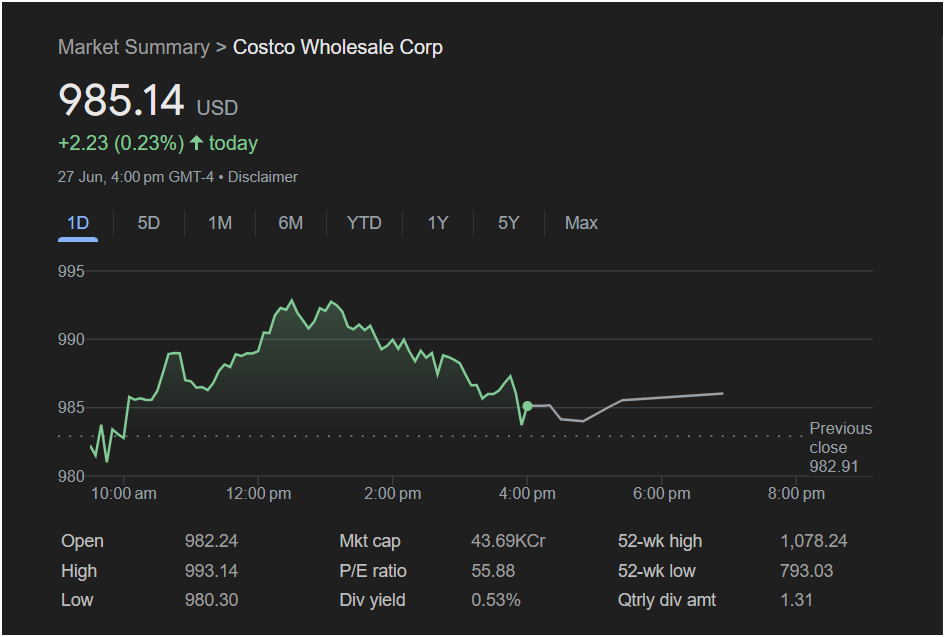
2.23 (0.23%) for the day and, importantly, kept it above the previous close of $982.91.
The Outlook for Friday: Key Levels to Watch
Without pre-market data to indicate the opening direction, traders must focus on the key price levels established during Thursday’s volatile session. The stock’s ability to hold its gains is a positive sign, but the failure to close near the high indicates the presence of selling pressure.
The market direction on Friday will likely be determined by which side—buyers or sellers—can assert control first.
Is It Right to Invest? A Strategy Based on Key Levels
For traders considering a position in Costco, the decision should be guided by how the stock behaves around these critical price points.
-
Key Resistance Level: The most crucial level on the upside is Thursday’s high of $993.14. If buyers can push the stock above this resistance, it would signal a continuation of the bullish trend and could open the door for further gains.
-
Key Support Levels: The first line of defense for the bulls is the closing price of
982.91 and, more significantly, the day’s low of $980.30. Holding above this low is critical to prevent a more bearish shift.
Investment Strategy Considerations:
-
For the Bulls: The strategy is to watch for a confirmed break above the $993.14 resistance. An entry on such a move could capitalize on renewed upward momentum.
-
For the Bears: Traders anticipating a pullback will be watching for the stock to fail at or near the $993.14 high. A move back down below $985 could be a signal to initiate a short position, targeting lower support levels.
-
For the Cautious: Given the mixed signals from Thursday’s trading, the most prudent approach is to observe the market’s opening action on Friday. Waiting to see if the stock establishes a clear trend above resistance or below support will provide a better-informed basis for an investment decision.
Comprehensive Trader’s Snapshot (Data from June 27)
-
Closing Price: 985.14 USD
-
Day’s Change: +2.23 (0.23%)
-
Previous Close: 982.91
-
Day’s Range: $980.30 (Low) to $993.14 (High)
-
52-Week Range: $793.03 to $1,078.24
-
Market Cap: 43.69KCr
-
P/E Ratio: 55.88
-
Dividend Yield: 0.53%
Costco stock demonstrated underlying strength by closing higher on a volatile day. However, the fade from the
993.14 (resistance)** and $980.30 (support) to guide their strategy.
Disclaimer: This article is for informational purposes only and is based on the analysis of the provided image. It does not constitute financial advice. All investors should conduct their own research and consult with a financial professional before making any investment decisions.

