
NEW YORK – International Business Machines Corp. (IBM) stock capped the last trading day with a robust rally, closing up significantly and putting its 52-week high squarely in sight. While momentum is clearly bullish, nearly flat pre-market activity suggests a critical test awaits at the opening bell on Monday.
The legacy tech giant closed the session at
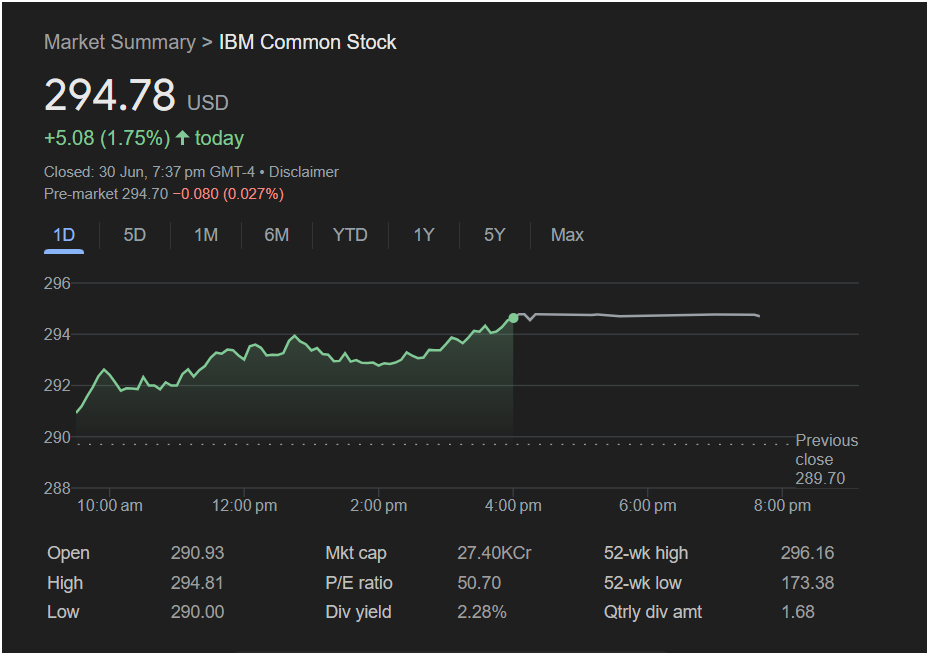
5.08 (1.75%). However, the initial signal for the next session is one of pause, with pre-market data showing the stock at $294.70, a negligible dip of 0.027%.
For traders preparing for the week, here is a complete breakdown of the information you need from IBM’s latest performance.
The Day in Review: A Picture of Strength
IBM’s daily chart is the definition of a bullish trend. The stock gapped up at the open to $290.93, well above the previous close of $289.70, and established a steady upward trajectory throughout the day. After hitting a low of $290.00 early on, buyers remained in firm control, pushing the stock to a high of $294.81 and closing just shy of that peak. This strong finish indicates that buying pressure persisted right into the closing bell.
Key trading day metrics:
-
Open: $290.93
-
High: $294.81
-
Low: $290.00
-
Closing Price: $294.78
Outlook for Monday: The Battle at the Highs
The most significant factor for IBM stock on Monday is its proximity to a major technical milestone. The pre-market indecision sets the stage for a crucial battle at this level.
-
Key Resistance: The 52-week high of $296.16. This is the most important price level to watch. Stocks often face significant selling pressure as they approach year-long highs. A decisive break above this level on strong volume could trigger a new wave of buying.
-
Immediate Support: The day’s high of
290.93.
Is It Right to Invest Today?
The decision to buy, sell, or hold IBM requires weighing its powerful momentum against potential valuation concerns.
The Bullish Case: The stock is in a confirmed uptrend, and the strong close indicates positive sentiment. For income-focused investors, IBM remains attractive with a healthy dividend yield of 2.28%. A breakout above the 52-week high would be a very strong technical signal for trend-following traders.
The Cautious Case: The primary reason for caution is twofold. First, the stock is at a major resistance level where a pullback is common. Second, the P/E ratio of 50.70 is elevated, suggesting that the stock is priced for significant growth and could be considered expensive relative to its current earnings. The flat pre-market could be an early sign that the rally is losing steam at this critical juncture.
for Traders:
IBM stock presents a classic “breakout or fakeout” scenario for Monday.
-
Short-term traders should be on high alert at the open. The area around the $296.16 52-week high is the battleground. A failure to break through could offer a short-selling opportunity, while a confirmed breakout could be a strong buy signal.
-
Long-term investors can be pleased with the performance but should be mindful of the high valuation. The attractive dividend provides a cushion, but some may wait to see if the stock can consolidate its gains or experience a healthy pullback before adding to their positions.
Monday’s price action will be pivotal in determining whether IBM has the strength to forge new highs or if it’s due for a rest.
Disclaimer: This article is for informational purposes only and is based on the analysis of the provided image. It should not be considered financial advice. Stock market conditions are volatile, and all investment decisions should be made with the guidance of a qualified financial professional.


