
Traders are closely analyzing Exxon Mobil stock (NYSE: XOM) this weekend after the energy giant finished the week on a down note, raising questions about its direction for the upcoming Monday session. A detailed look at Friday’s performance and pre-market indicators suggests the stock is at a critical juncture, with clear support and resistance levels that will dictate its next move.
For any trader planning their strategy, here is a comprehensive breakdown of what the numbers tell us and what to look for when the market opens.
Friday’s Performance: A Story of Weakness
Exxon Mobil’s stock chart from the last trading session paints a bearish picture. Here are the essential details from the day’s activity:
-
Closing Price: XOM closed at
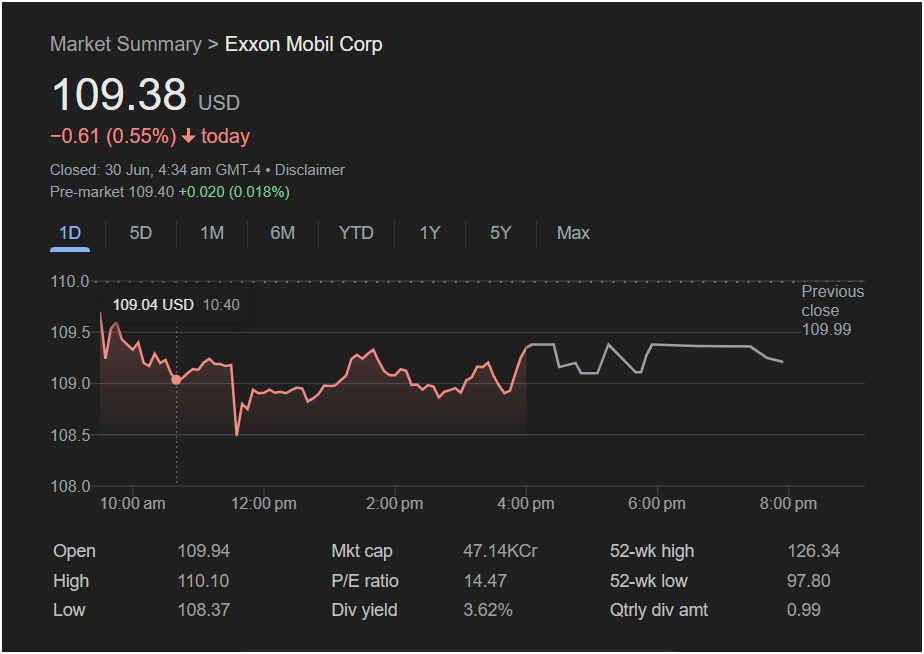
0.61 (0.55%) for the day.
-
Intraday Trend: The stock opened at $109.94, just below the previous close of $109.99. After a brief attempt to rally to a high of
108.37**. While the stock recovered slightly from its low, it spent the rest of the day trading sideways and failed to reclaim its opening price, a sign of underlying weakness.
The Pre-Market Signal: Indecision Reigns
For traders looking for a clue about Monday’s open, the pre-market data offers little excitement.
-
Pre-Market Activity: As of the last update, XOM was trading at
0.020 (0.018%).
This flat pre-market performance indicates a state of indecision in the market. Unlike stocks that show strong overnight momentum, Exxon Mobil is signaling a potentially quiet or “wait-and-see” opening for Monday. The lack of a strong pre-market push suggests that a significant gap up at the open is unlikely without a new market catalyst, such as a sharp move in oil prices.
What Traders Must Watch on Monday
Given the bearish close and neutral pre-market, Exxon Mobil stock is currently range-bound. A trader’s strategy for Monday should be centered on watching for a breakout from this range.
Key Levels to Monitor:
-
Critical Support: The most important level on the downside is the daily low of $108.37. If the stock breaks below this support level on Monday, it could trigger further selling pressure and signal a continuation of the downtrend.
-
Immediate Resistance: The primary hurdle on the upside is the
110.10. For the stock to show any bullish strength, it needs to decisively break through and hold above this resistance zone.
Investment Strategy Considerations:
-
Is it right to invest today? Based on the technical signals, this is not a clear-cut “buy” for momentum traders. The stock is showing weakness and is caught in a tight range. A prudent approach would be to wait for confirmation.
-
The Bullish Case: A break above $110.10, especially on high trading volume, could indicate a reversal and attract buyers.
-
The Bearish Case: A break below $108.37 would confirm the bearish trend from Friday and could present a shorting opportunity or a signal for long holders to become cautious.
Fundamental Context:
It’s worth noting that Exxon Mobil offers a substantial dividend yield of 3.62% and has a reasonable P/E ratio of 14.47. These factors often provide a floor for the stock price, as they attract long-term value and income investors. This could be the reason the stock found support and didn’t fall further on Friday.
Exxon Mobil stock enters the new week in a state of consolidation after a weak showing. The forecast for Monday is neutral to slightly bearish, with the stock likely to remain trapped between
110.10 until a new catalyst emerges. Traders should avoid jumping in prematurely and instead watch these key levels closely for a confirmed breakout or breakdown before committing to a position.
Disclaimer: This article is an analysis based on the provided image and does not constitute financial advice. Stock market performance is subject to volatility and various market factors. All traders should conduct their own research and consider their risk tolerance before making any investment decisions.

