
NEW YORK – Medtronic PLC (NYSE: MDT) is demonstrating significant bullish strength in today’s trading session, signaling positive sentiment among investors. As of 10:24 am GMT-4 on June 16, the stock is trading at
1.30 (1.49%) for the day. This robust performance prompts a key question for traders: Is this momentum sustainable, and what can we expect when the market opens on Monday?
This article breaks down all the critical data from today’s session to provide a comprehensive outlook.
Today’s Trading Session: A Closer Look
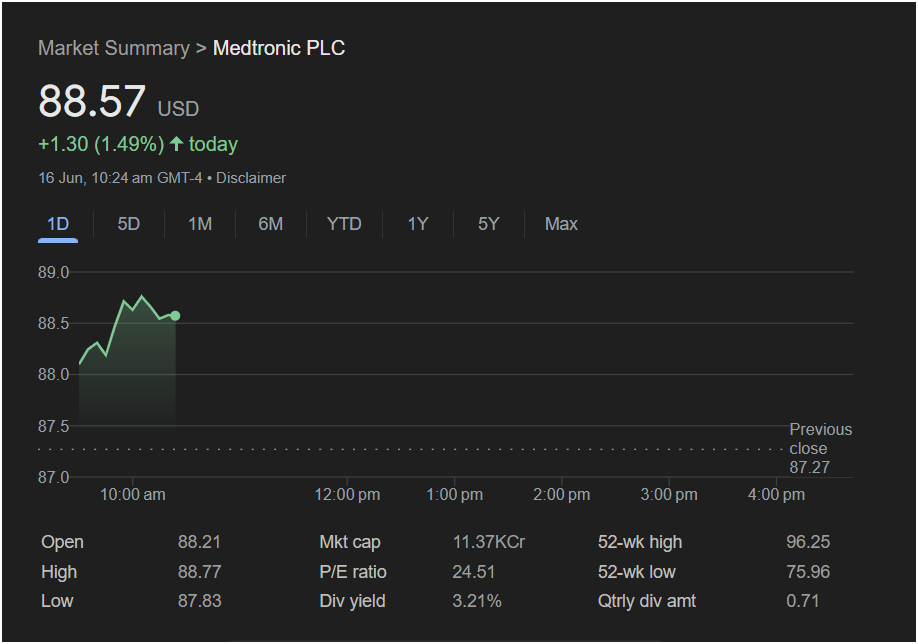
The intraday chart reveals a clear upward trend. Medtronic opened at $88.21, slightly below the previous day’s close of $87.27. After a brief dip, the stock began a strong rally, reaching a high of $88.77. The current price of $88.57 indicates that the stock is holding onto most of its gains, consolidating near the day’s peak. This price action suggests strong buying pressure and a lack of significant selling, a positive indicator for short-term performance.
 Key Financial Metrics for Traders
To understand the full picture, a trader must look beyond the price chart. Here’s a breakdown of Medtronic’s vital statistics presented in the market summary:
-
Valuation (P/E Ratio): At 24.51, Medtronic’s Price-to-Earnings ratio is moderate. It doesn’t suggest the stock is excessively overvalued or a deep bargain, placing it in a reasonable range for a stable, large-cap company in the healthcare sector.
-
Income Potential (Div Yield): The dividend yield is an attractive 3.21%, with a quarterly dividend amount of $0.71 per share. This is a significant draw for income-focused investors and can provide a cushion during periods of market volatility. A strong and reliable dividend often attracts long-term buyers, providing price support.
-
Price Range (52-Week High/Low): The stock’s 52-week range is between
96.25. The current price of $88.57 sits firmly in the upper half of this range, indicating a sustained recovery from its lows. However, there is still considerable room to grow before it tests its 52-week high, suggesting potential upside.
-
Company Size (Market Cap): The market capitalization is listed as 11.37KCr. While the “Cr” (Crore) notation is unusual for a US listing, it signifies that Medtronic is a very large company with a market cap in the hundreds of billions of dollars, making it a stable blue-chip stock.
Outlook for Monday: Will the Uptrend Continue?
Based on the available data, the outlook for Medtronic stock on Monday appears cautiously optimistic.
The Bullish Case:
The strong intraday performance, closing near the day’s high on significant positive change, creates powerful upward momentum. This momentum often carries over into the next trading session, especially when not triggered by a one-off news event. The solid dividend yield provides an underlying reason for investors to buy and hold, which can help sustain the price level. If the broader market sentiment remains positive over the weekend, Medtronic is well-positioned to continue its climb on Monday, potentially testing the $89.00 resistance level.
The Cautious Case:
Traders should watch if the stock can break through the day’s high of $88.77 at Monday’s open. Failure to do so could lead to short-term profit-taking, causing a slight pullback. The overall market conditions will also play a crucial role.
Verdict on Investing Today:
For a day trader, the stock has already made a significant move. For a swing or long-term investor, the combination of positive momentum, a strong dividend, and a valuation that isn’t overstretched presents a compelling picture. The analysis suggests that the stock is currently in a healthy uptrend.
Medtronic PLC has shown definitive signs of strength. Its upward price movement is supported by solid fundamentals, making it appealing to a wide range of investors. While no outcome is guaranteed, the technical and fundamental indicators point towards potential continued strength into Monday’s session. Traders should watch the opening price action closely for confirmation of the trend’s continuation.
Disclaimer: This article is for informational purposes only and is based on an analysis of a historical data snapshot. It does not constitute financial advice. Stock market investments are subject to risk, and past performance is not indicative of future results. Please conduct your own research and consult with a qualified financial advisor before making any investment decisions.

