
Bank of America Corp (BAC) finished its latest trading session on a positive note, demonstrating resilience after an early dip. The banking giant’s stock closed the day at
0.19 (0.41%).
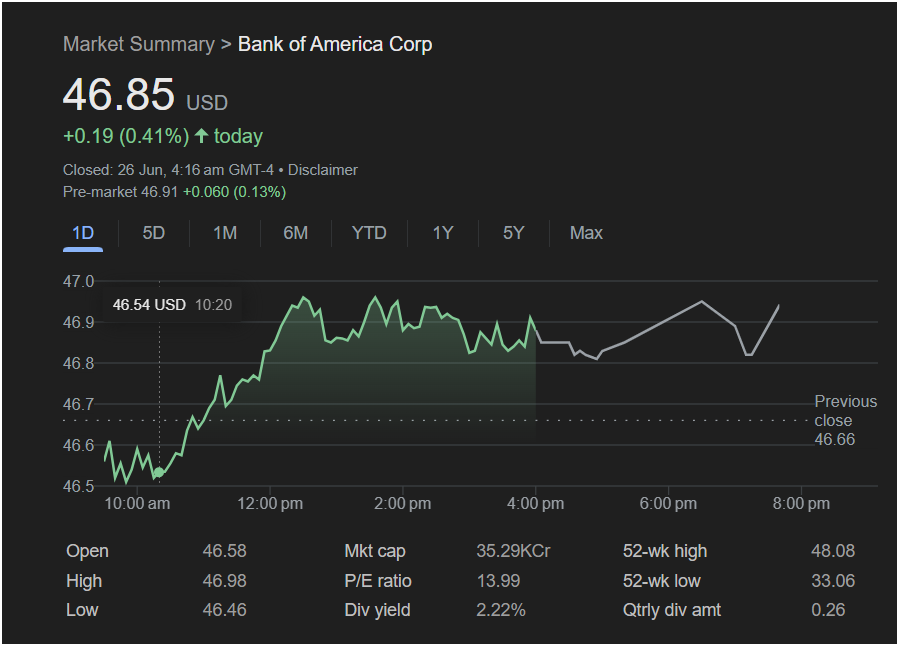
Further boosting investor confidence, pre-market trading shows the stock ticking higher to $46.91, an additional gain of 0.13%. This suggests that the positive sentiment is carrying over. This analysis will break down the trading session and provide a technical outlook for what traders should be watching next.
 Wednesday’s Market Performance: A Day of Recovery and Strength
The intraday chart for Bank of America shows a constructive trading session. After opening at $46.58 and briefly touching a low of $46.46, buyers stepped in decisively, pushing the stock on a steady rally through the morning to a high of $46.98. The afternoon was characterized by healthy consolidation, where the stock held most of its gains, closing strong.
Here are the key data points from the session:
-
Open: 46.58
-
High: 46.98
-
Low: 46.46
-
Previous Close: 46.66
-
Closing Price: 46.85
The ability to recover from an opening dip and close firmly in positive territory is a bullish signal. It indicates that buyers were willing to absorb any early selling pressure and were in control for most of the day.
Key Technicals and Fundamentals for Traders
Technical Analysis:
After rallying, the stock established a new area of support around the consolidation zone of
46.98**, now serves as the immediate resistance level. A break above this level would be a very bullish sign, opening the door for a potential test of the 52-week high. The positive pre-market action supports this bullish case.
Fundamental Indicators:
-
P/E Ratio: With a low P/E ratio of 13.99, Bank of America stock appears attractively valued, especially compared to the broader market. This suggests the price is well-supported by its earnings.
-
Dividend Yield: A respectable 2.22% dividend yield offers investors a steady income stream, making the stock appealing to both growth and income-oriented portfolios.
-
52-Week Range: The stock is trading near its 52-week high of $48.08. This proximity to its peak is a sign of underlying strength and a sustained uptrend.
Outlook: Will the Stock Go Up or Down?
The outlook for Bank of America stock is cautiously bullish. The positive closing momentum, combined with a constructive chart pattern and favorable pre-market trading, suggests that the path of least resistance is upward.
Traders should watch for the stock to challenge the day’s high early in the session. A successful break could fuel further buying toward the major resistance at the 52-week high.
Key levels to watch for the next session:
-
Support: The consolidation level around
46.46 are key areas of support.
-
Resistance: The immediate resistance is the day’s high of
48.08.
Is It Right to Invest Today?
This decision depends on your investment strategy.
-
For Short-Term Traders: The momentum is positive. Buying on a confirmed break above $46.98 or on any small dip towards the $46.80 support level could be a viable strategy to play the current upward trend.
-
For Long-Term Investors: Bank of America is a cornerstone of the financial sector. The combination of a low P/E ratio and a solid dividend yield presents a compelling value proposition. For those with a long-term horizon, accumulating shares during periods of strength within a clear uptrend is a common and sound strategy.
In conclusion, Bank of America stock is showing solid bullish momentum, backed by attractive fundamentals, setting the stage for a potential test of its yearly highs.

