
GE Vernova Inc. (NYSE: GEV) stock is positioned at a critical juncture for investors after a session of extreme volatility. The energy-focused company finished the day with a slight gain, closing up +0.66% at $486.96, but this modest green close belies a dramatic intraday struggle between buyers and sellers.
With pre-market trading essentially flat at $487.00, all eyes are now on whether the stock can muster the strength to challenge its 52-week high and the psychological $500 barrier.
A Wild Ride to a Quiet Close
The 1-day chart for GE Vernova tells a story of a fierce battle. The stock exploded out of the gate, rocketing to a session high near
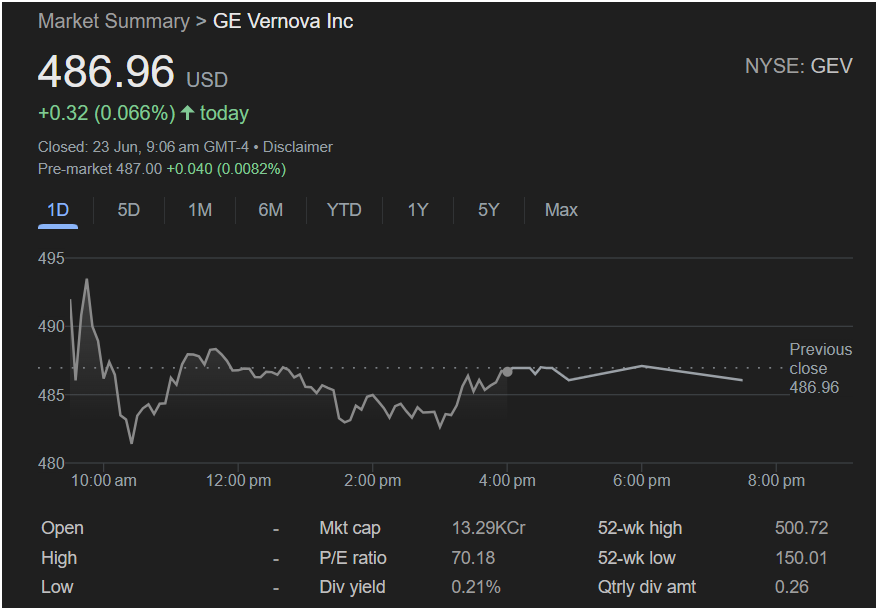
481 by mid-morning.
For the majority of the day, GE Vernova stock carved out a new, lower trading range. A significant development occurred in the final two hours of trading, where the stock staged a steady recovery off its lows, climbing back to close near the top of its afternoon range. This late-day strength is a positive sign, but the failure to hold the morning’s highs suggests significant resistance overhead.
Key Financial Metrics for Traders
Investors must consider the stock’s rich valuation and its market position:
-
Previous Close: $486.96
-
P/E Ratio: 70.18
-
Dividend Yield: 0.21%
-
52-Week Range: $150.01 – $500.72
-
Market Cap: Approximately $133 Billion (Note: The “13.29KCr” figure in the image is a regional display format and does not reflect the company’s USD market capitalization).
The standout metric is the high P/E ratio of over 70, which indicates that investors have priced in significant future growth. This makes the stock more sensitive to earnings performance and market sentiment. The current price is also hovering just below its 52-week high of $500.72, a major technical and psychological resistance level.
Outlook for Monday: Will the Stock Go Up or Down?
The outlook for Monday is cautiously bullish but hinges entirely on breaking key resistance. The late-day recovery is constructive, but the stock is entering a technically challenging zone.
What to Watch:
-
Resistance at the 52-Week High ($500.72): This is the most important level. A decisive breakout above this price, and the psychological $500 mark, would be a very strong bullish signal and could trigger a new leg up.
-
Support at the Day’s Low (~$481): This level represents the line in the sand for bulls. If the stock breaks below this support, it would negate the positive late-day action and suggest that sellers are back in control, potentially leading to a deeper pullback.
-
The Morning High (~$494): Before tackling the all-time high, the stock must first overcome the resistance created by the failed morning rally. A move above this level would signal strong bullish intent.
Is it right to invest today?
This is a high-stakes scenario. For traders, the risk/reward is elevated. A breakout trade could be initiated on a strong move above the $500 level. Conversely, a failure and rejection at this level could present a shorting opportunity for bearish traders.
For long-term investors, caution is warranted. Buying a stock with a high P/E ratio as it approaches its 52-week high can be a risky proposition. It may be more prudent to wait for either a confirmed breakout to validate the upward momentum or a market pullback that offers a more attractive entry point. The action on Monday will be crucial in setting the tone for the week.

