A Detailed Look at Intraday Stock Market Data
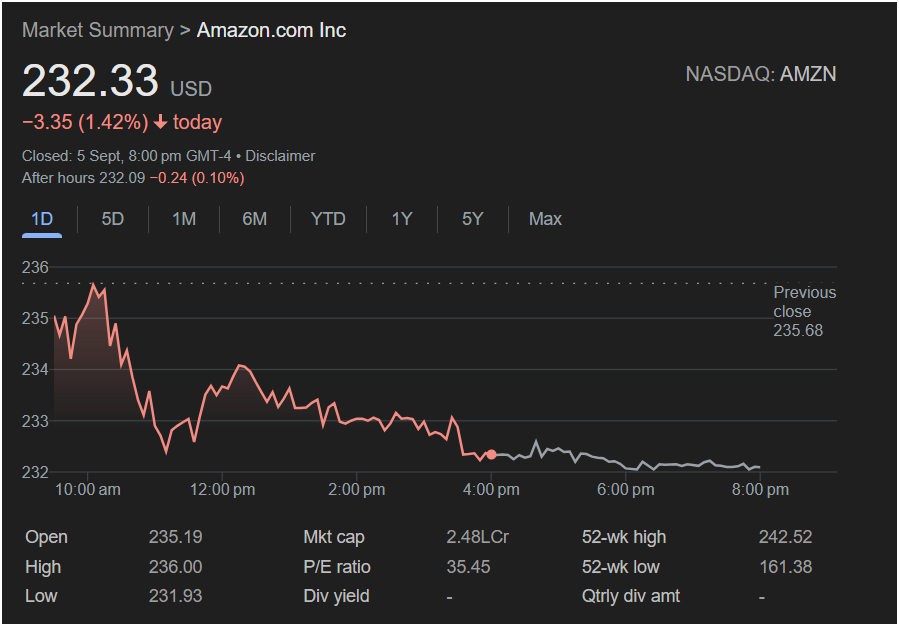
The provided image displays a snapshot of Amazon.com Inc.’s (AMZN) market summary and its intraday stock performance as of a specific date. This data offers valuable insights into how the stock traded throughout a single day, highlighting price movements, key financial metrics, and overall market sentiment during that period.
At the very top, the “Market Summary” clearly identifies the company as “Amazon.com Inc” and its NASDAQ ticker symbol as “NASDAQ: AMZN.” This immediate identification sets the context for all subsequent data points.
Current Trading Price and Daily Change:
The most prominent figure is the current trading price: 232.33 USD. This is the last recorded price at the time the screenshot was taken. Immediately below it, we see the daily change: -3.35 (1.42%) marked in red, indicating a decrease. The word “today” further emphasizes that these figures reflect the performance for the current trading day. This visual cue (red color) instantly signals a negative performance for the day.
Trading Session Timelines:
Further details about the trading session are provided:
-
Closed: 5 Sept, 8:00 pm GMT-4 Disclaimer This indicates the official closing time and date for the primary trading session. The “GMT-4” specifies the time zone.
-
After hours 232.09 -0.24 (0.10%) This line reveals activity occurring outside of regular market hours. “After hours” trading is less liquid but can reflect immediate reactions to news released after the market closes or before it opens. Here, AMZN traded slightly lower after hours, down 0.24 USD or 0.10%, from its closing price.
Interactive Timeframes:
Below the main price data, a series of tabs allows users to view performance over different timeframes: “1D”, “5D”, “1M”, “6M”, “YTD”, “1Y”, “5Y”, and “Max”. The “1D” tab is currently selected, confirming that the chart displayed below represents the stock’s performance over a single day. This feature is crucial for investors who want to analyze short-term, medium-term, or long-term trends.
Intraday Price Chart:
The central and most visually informative part of the image is the line graph charting Amazon’s stock price throughout the day.
-
X-axis (Time): The horizontal axis marks time intervals from “10:00 am” to “8:00 pm”, spanning the regular trading hours and extending into the after-hours session.
-
Y-axis (Price): The vertical axis displays the stock price, ranging approximately from 232 to 236.
-
The Price Curve: The red line illustrates the stock’s movement. It begins around 235.19 (the open price) and quickly rises to a high of 236.00 around 10:30 am. Following this peak, the stock experiences a significant decline, dropping below 234 by noon, and then oscillating downwards throughout the afternoon. A subtle change in color to grey for the latter part of the chart, specifically after 4:00 pm, likely denotes the transition from regular trading hours to after-hours trading, mirroring the “After hours” data point mentioned earlier. The lowest point reached during the day appears to be around 231.93.
Key Daily Metrics:
At the bottom of the image, a table provides specific daily and fundamental metrics:
-
Open: 235.19 This is the price at which the stock started trading at the beginning of the regular market session for the day.
-
High: 236.00 This represents the highest price reached by the stock during the day’s trading.
-
Low: 231.93 This indicates the lowest price at which the stock traded during the day.
-
Previous close: 235.68 This is the closing price from the prior trading day. Comparing the current close (implied by the 232.33) with the previous close confirms the negative daily change.
Additional Financial Metrics:
Beyond the daily trading figures, the table also includes several fundamental metrics that provide a broader financial context for Amazon:
-
Mkt cap: 2.48L Cr “Mkt cap” stands for Market Capitalization, which is the total value of a company’s outstanding shares. “2.48L Cr” indicates a very large market capitalization, where “L” often signifies Lakh (100,000) and “Cr” signifies Crore (10 million), pointing to a massive valuation typical of a company like Amazon. This figure would need to be clarified regarding the specific currency and scale (e.g., 2.48 Lakh Crore rupees, or 2.48 Trillion dollars, depending on the implicit currency for ‘Cr’). Assuming standard financial reporting contexts, it would likely translate to trillions of USD.
-
P/E ratio: 35.45 The Price-to-Earnings (P/E) ratio is a valuation multiple that compares a company’s current share price to its per-share earnings. A P/E of 35.45 suggests that investors are willing to pay 35.45 times the company’s annual earnings per share for its stock. This can be interpreted in various ways depending on the industry and growth expectations.
-
Div yield: – “Div yield” refers to Dividend Yield, which is the amount of dividends paid out to shareholders relative to the stock’s price. The hyphen indicates that Amazon does not currently pay a dividend.
-
52-wk high: 242.52 This is the highest price the stock has traded at over the past 52 weeks (one year).
-
52-wk low: 161.31 This is the lowest price the stock has traded at over the past 52 weeks. These two figures provide context on the stock’s trading range over a longer period, showing its volatility and investor sentiment over the last year.
-
Qtrly div amt: – “Qtrly div amt” stands for Quarterly Dividend Amount. The hyphen here reinforces that Amazon does not issue quarterly dividends.