हस्तरेखा शास्त्र के अनुसार हथेली पर कई प्रकार की रेखाएं एवं आकृतियां बनी होती हैं. जिसके माध्यम से व्यक्ति के भाग्य, सेहत, विवाह, सुख-सुविधाएं, आर्थिक स्थिति एवं नौकरी आदि से संबंधित कई बातों का पता लगाया जा सकता है.
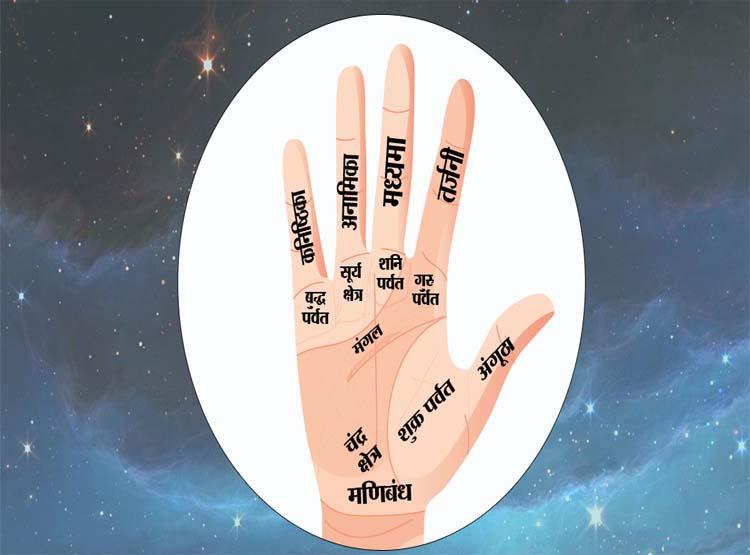
हस्त रेखा (Hast Rekha) के मुताबिक हथेली पर सूर्य रेखा और गुरु पर्वत का विशेष महत्व होता है. गुरु पर्वत पर बने शुभ निशान से भविष्य में तरक्की के योग बनते हैं. जबकि सूर्य रेखा से नौकरी में सफलता के योग होते हैं.
हस्तशास्त्र के आधार पर व्यक्ति की हथेली से आर्थिक स्थिति की दशा का अंदाजा लगाया जा सकता है. अधिकतर लोग जॉब सिक्योरिटी और सरकारी नौकरी की चाहत रखते हैं. सब लोगों की इच्छा होती है कि जीवन में उच्च स्थान प्राप्त हो. लेकिन क्या आप जानते हैं कि हथेली में नौकरी से जुड़े राज भी छुपे होते हैं. आइए जानते हैं हाथ की लकीरों का नौकरी से संबंध.
हथेली में हृदय रेखा, मस्तिष्क रेखा और जीवन रेखा मुख्य 3 रेखाएं होती हैं. यदि इन रेखाओं को कोई और रेखा काट नहीं रही हो तो समझ लीजिए कि ऐसे व्यक्ति के जीवन में किसी भी तरह का तनाव नहीं होगा. साथ ही ऐसे लोग व्यक्तिगत और सामाजिक जीवन को बैलेंस करने में सक्षम होते हैं.
जीवन रेखा बृहस्पति यानी गुरु पर्वत की ओर जाए तो ऐसे व्यक्ति को जीवन में ऊंचाइयों तक पहुंचने में सफलता मिलती है. साथ ही यदि ऐसे लोग सरकारी नौकरी के लिए प्रयासरत हों तो सफलता मिलने की संभावनाएं अधिक होती हैं.
व्यक्ति के हाथ में जीवन रेखा से भाग्य रेखा निकलते हुए सूर्य पर्वत की ओर जाए तो नौकरी में ख़ूब तरक्की मिलती है. इसके अलावा उच्च पदाधिकारी बनने के योग भी मजबूत होते हैं. वहीं, यदि भाग्य रेखा शनि पर्वत की ओर से दोनों हथेलियों में दिखे तो ऐसे व्यक्ति को प्रशासनिक पद मिलने के योग होते हैं.
जिन लोगों के हाथ में कोई रेखा जीवन रेखा से निकलते हुए बिना किसी रेखा को काटे बृहस्पति या गुरु पर्वत पर मिलती है तो सरकारी नौकरी मिलने की संभावनाएं प्रबल होती हैं. ऐसे रेखा वाले व्यक्तियों को निश्चित तौर पर सरकारी नौकरी मिलती है.


