गुंडरदेही के खेखरी बांध में मिली पदमनी साहू (32 वर्ष) की सिर कटी लाश का मामला सुलझ गया है। पदमनी की हत्या उसके पति जगदीश साहू (36 वर्ष) ने ही की थी। हत्या के बाद वीभत्स ढंग से शव के टुकड़ों को ठिकाने लगाया। हत्या की वजह पारिवारिक विवाद बताई गई है। सनकी पति की खेखरी बांध में महिला की सिर कटी लाश सोमवार सुबह देखी गई थी। धड़ से हाथ और पैर भी अलग थे। चौकी पुलिस जांच में जुटी थी, तभी गांव के जगदीश साहू ने थाने पहुंचकर अपने पत्नी की गुमशुदगी की शिकायत की।
पुलिस को बताया कि उसकी पत्नी अपने सारे जेवरात लेकर कहीं चली गई है। इसी बीच उसने बांध में मिले महिला के शव को अपनी पत्नी का होना बताया। जगदीश की बातों और हरकतों से पुलिस को उस पर संदेह हुआ। पुलिस टीम ने पहले जगदीश के घर को सर्च किया।
जगदीश ने जो गहने पदमनी द्वारा ले जाने की बात कही गई थी, वह एक पोटली मिली, वहीं खून के कुछ धब्बे भी दिखे। जिस कंटीले तार से पदमनी का शव बांधा गया था, उसी तार का हिस्सा जगदीश के घर में दिखा। पूछताछ पर जगदीश ने अपनी पत्नी की हत्या की बात स्वीकार ली।
सामाजिक बैठक तक पहुंच गया था विवाद
पदमनी और जगदीश की शादी साल 2009 में हुई थी। शादी के बाद से दोनों के बीच विवाद होते रहता था। ग्रामीणों ने बताया कि जगदीश सनकी प्रवृत्ति का व्यक्ति है। वह छोटी-छोटी बात में अपनी पत्नी से मारपीट करता था। कुछ समय पहले भी उसने पदमनी को बुरी तरह पीटा था। मायके पक्ष के लोग गुंडरदेही पहुंचे थे, तब सामाजिक बैठक में दोनों का विवाद सुलझा लिया गया था। लेकिन जगदीश की हरकत थमी नहीं।
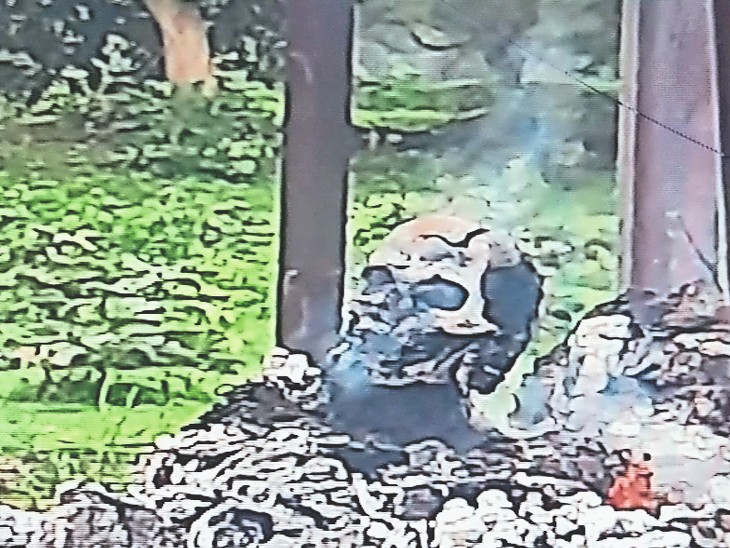
ग्रामीणों ने ली थी श्मशान घाट में चिता की तस्वीर
पदमनी के सर कटी लाश मिलने के दिन कुछ ग्रामीणों ने श्मशान घाट की चिता में खोपड़ी की यह तस्वीर ली। आमतौर पर किसी भी चिता में सिर का हिस्सा खड़ी स्थिति में नहीं होता। इसी से संशय हुआ की यह सिर किसी अन्य का है। आरोपी ने स्वीकारा की उसने अपनी पत्नी का सिर इसी चिता में डाला था। घटना वाले दिन गांव के श्मशान घाट में सिर्फ एक ही चिता जली थी। पुलिस को आशंका है कि यही पदमनी के सिर का कंकाल है।
दिन में हत्या की, रात में शव के किए टुकड़े
जगदीश ने पुलिस को बताया कि 12 जुलाई को बच्चों के स्कूल जाने के बाद उसका पदमनी से विवाद हुआ। दोपहर करीब 3 बजे उसने विवाद के दौरान पदमनी की गला दबाकर हत्या कर दी। इसके बाद शव को घर के कमरे में छिपा दिया।
रात में जब बच्चे सो गए तो उसने आरी और टंगिया से पदमनी का सिर काटा और गांव के श्मशान में जलती चिता में सिर फेंक आया। इसके बाद हाथ-पैर धड़ से अलग किया। सभी हिस्सों को घर में रखे कंटीले तार से बांधकर बांध में डुबा दिया और तार का दूसरा हिस्सा झाड़ियों से कसकर बांध दिया ताकि शव बाहर न आ सके।
साले ने धमकाया तब थाने में आरोपी ने की शिकायत
सुबह बच्चों ने अपनी मां के बारे में पिता जगदीश से पूछा। लेकिन जगदीश ने बच्चों को यह कहकर गुमराह कर दिया कि उनकी मां मायके गई है। 14 जुलाई को उसने अपने मायके में भी फोन किया और पदमनी के कहीं चले जाने की बात कही।
पदमनी का मायके पक्ष पहले ही जगदीश की हरकत और सनकी प्रवृत्ति से वाकिफ था, उसके साले ने थाने में शिकायत करने की धमकी दी। इसके बाद जगदीश खुद ही अंबागढ़ चौकी थाने पहुंच गया और पुलिस को गुमराह करने अपनी पत्नी की गुमशुदगी की शिकायत दर्ज कराई। खुलासा के बाद आगे की प्रक्रिया पूरी कर रहे हैं।
बच्चों के सिर से उठा साया भाई बोला- बलि दी गई है
जगदीश और पदमनी के 10 साल की बेटी और 8 साल का बेटा है। जगदीश की हरकतों की वजह से दोनों का ही लगाव अपने मां के साथ रहता था। अब दोनों बच्चों के सिर से मां का साया भी छिन गया। इधर पदमनी के भाई राकेश साहू ने आरोप लगाया है कि उसकी बहन की बलि दी गई है।
उन्होंने पुलिस से शिकायत की है कि घर में सिंदूर और नींबू भी देखा गया है। वहीं सिर काटकर उसे श्मशान की चिता में फेंका जाना सामान्य नहीं हैं। जगदीश के परिवार के एक सदस्य को तांत्रिक होना भी बताया।
शव के हिस्से तलाशने में पुलिस की अहम भूमिका
जगदीश ने बड़ी ही निर्ममता से पदमनी के शव के टुकड़े किए थे। काटे गए हाथ-पैर को भी समेटकर बांध की झाड़ियों से बांध दिया था, ताकि कोई भी हिस्सा बाहर न आए। लेकिन धड़ मिलने के बाद पुलिस की गोताखोर टीम ने दो दिनों तक सर्च ऑपरेशन चलाया। तालाब के हर हिस्से को खंगाला इसके बाद मृतका के हाथ-पैर भी बरामद हुए। हालांकि शव चिता में जल जाने की वजह से नहीं मिल पाया। एसपी प्रफुल्ल ठाकुर ने बताया कि इस एंगल से भी मामले की जांच की जा रही है।


