
Berkshire stock (Berkshire Hathaway Inc Class A, Ticker: BRK.A) finished a volatile trading session on Friday with key signals that have traders and investors eagerly anticipating Monday’s market open. While the stock closed down for the day, a closer look at the intraday action reveals a compelling story of resilience that could set the tone for the week ahead.
This article breaks down Friday’s trading data to provide a comprehensive analysis for traders considering their next move.
Friday’s Market Recap: A Tale of Two Halves
Based on the market summary from June 30th, here is a breakdown of the key metrics for Berkshire Hathaway Class A:
-
Closing Price: 7,28,800.00 USD
-
Daily Change: -2,139.88 (-0.29%)
-
Day’s High: 7,31,999.00
-
Day’s Low: 7,26,203.06
-
Previous Close: 7,30,939.90
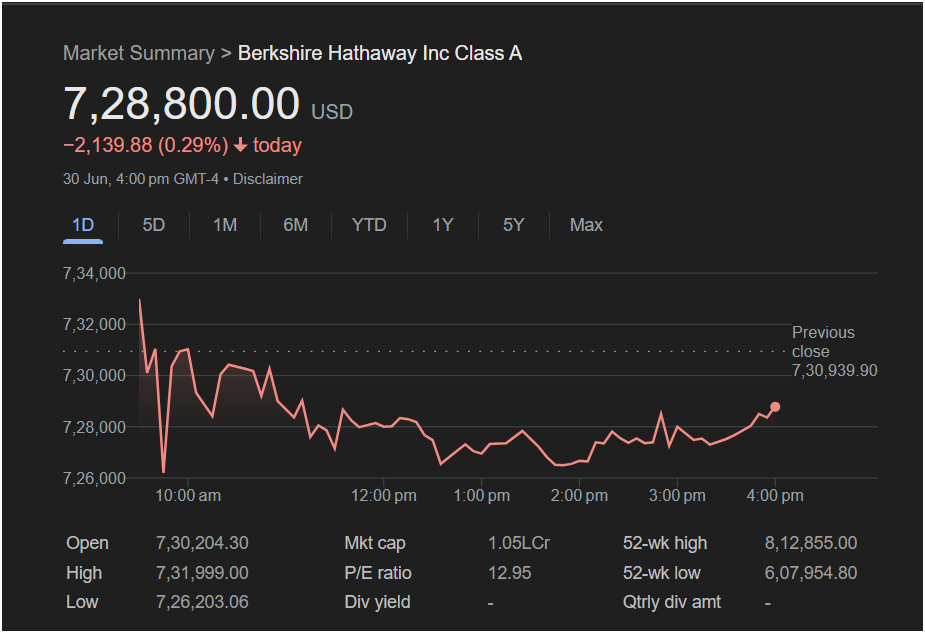 The trading day began with significant selling pressure, with the stock opening at 7,30,204.30 and quickly falling to its low point of 7,26,203.06 before 10:00 am. For most of the day, the stock traded in a sideways pattern, struggling to regain its footing.
However, the most crucial part of the day for future predictions occurred in the final hour. From approximately 3:00 pm to the 4:00 pm close, BRK.A staged a noticeable rally, moving decisively upwards. This late-session buying interest is a bullish indicator, suggesting that investors saw the lower prices as a buying opportunity and that momentum is shifting in a positive direction heading into the weekend.
The Bullish Case: Will the Market Go Up on Monday?
Traders looking for an upward move on Monday have several strong points to consider:
-
Closing Momentum: The strong rally into the close is the most significant bullish signal. This indicates that buyers had the upper hand as the session ended, and this positive sentiment could easily carry over to Monday’s opening bell.
-
Established Support Level: The stock found solid support at the day’s low of ~$7,26,200. It bounced off this level and never re-tested it, suggesting that there is strong demand at that price point. This level now serves as a critical floor for traders to watch.
-
Fundamental Value: With a P/E ratio of 12.95 shown in the summary, Berkshire Hathaway is not trading at an excessive valuation. For long-term investors, any dip in a fundamentally strong company like this is often seen as a chance to accumulate shares.
The Bearish Case: Potential for a Downward Move
Despite the positive finish, traders must also consider the bearish signals:
-
It Was a Down Day: The stock still closed in the red. The initial sell-off was strong, and if broader market sentiment is negative on Monday, that early-day weakness could reappear.
-
Key Resistance Ahead: BRK.A closed significantly below its previous close of 7,30,939.90 and the day’s high of 7,31,999.00. These price levels will now act as the first major points of resistance. A failure to break through these early on Monday could invite more selling.
Is It Right to Invest Today (on Monday)?
For the Trader: The decision to invest on Monday will depend on your risk tolerance and trading strategy.
-
Aggressive traders might interpret the strong close as a clear buy signal, potentially entering a position at or near the open, using the day’s low (~$7,26,200) as a stop-loss level.
-
Conservative traders may prefer to wait for more confirmation. A decisive move above the resistance level of ~$7,31,000 would be a much stronger signal that the upward trend is confirmed and has momentum.
Key Level to Watch on Monday: The most important indicator will be the price action around the $7,30,000 – $7,31,000 range. If the stock can open and hold above this area, the outlook for the day is very positive. If it gets rejected at this level, a re-test of Friday’s lows is possible.
Friday’s trading session for Berkshire stock was a classic battle between bears and bulls. While the bears won the day on paper with a negative close, the bulls won the final, crucial hour. This late-day strength provides a cautiously optimistic outlook for Monday. Traders should watch the opening price action closely and monitor the key support and resistance levels outlined above to make an informed decision.
Disclaimer: This article is for informational purposes only and is based on an analysis of the provided image. It should not be considered financial advice. All investment decisions should be made with the help of a qualified financial professional.

